pkgs <- c("ggthemes", "jhtools", "glue", "ggsci", "patchwork", "tidyverse",
          "circlize", "ComplexHeatmap", "SummarizedExperiment", "jhuanglabRNAseq",
          "viridis","ggrepel", "tidygraph","ggraph")
for (pkg in pkgs){
  suppressPackageStartupMessages(library(pkg, character.only = T))
}
out_dir <- "./results/sup_figure7" %>% checkdir
in_dir <- "./data" %>% checkdirsup_figure7
sup_figure7A
group_color <-  glue("{in_dir}/group_color.rds") %>% read_rds
pieframe<- glue("{in_dir}/twist2_idh_pie.rds") %>% read_rds()
pieframe <- pieframe %>%
  group_by(label, IDH) %>%
  summarise(n = n()) %>%
  group_by(IDH) %>%
  mutate(prop = n/sum(n))
a <- ggplot(pieframe, aes(x = "", y = prop, fill = label)) +
  geom_bar(width = 1, stat = "identity", color = "white") +
  coord_polar("y", start = 0)+
  scale_fill_manual(values = group_color) +
  theme_void()+
  facet_wrap(~IDH)
pdf(glue("{out_dir}/figS7A.pdf"),width = 5, height = 4)
print(a)
d <- dev.off()
a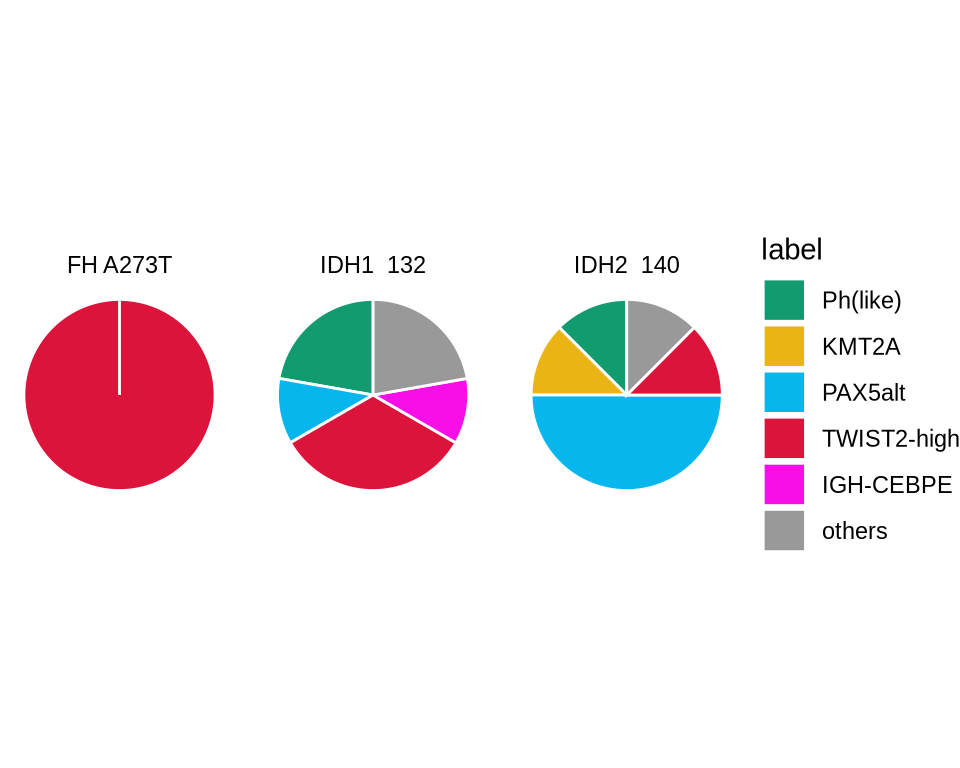
sup_figure7B
mx <- read_rds(glue("{in_dir}/twist2_idh_heatmap.rds"))
cluster_annotation <- read_rds(glue("{in_dir}/twist2_idh_anno.rds"))
group_color <-  glue("{in_dir}/group_color.rds") %>% read_rds
totalcodf <- glue("{in_dir}/twist2_idh_colod.rds") %>% read_rds
ha <- HeatmapAnnotation(
  "subtypes" = cluster_annotation$label,
  "IDH1/2 mutation" = cluster_annotation$IDH,
  "FH_A273T" = cluster_annotation$FH_A273T,
  col = list(
    "subtypes" = group_color,
    "IDH1/2 mutation" = c("IDH2_140" = "#A0522D", "IDH1_132" = "#FA8072"),
    "FH_A273T" = c("FH_A273T" = "black"),
    tmp_df = c("TRUE" = "black")
  ),
  simple_anno_size = unit(3, "mm"),
  annotation_height = unit(12, "mm"),
  show_legend = F,
  show_annotation_name = T,
  annotation_name_gp = gpar(fontsize = 10),
  border=T,
  gap = unit(0, "mm")
)
ht <- Heatmap(t(mx[cluster_annotation$sample_id,]),
              col = circlize::colorRamp2(breaks = c(-2,0,2), c("blue", "white", "red")),
              column_split = factor(cluster_annotation$label2, levels = totalcodf),
              clustering_method_columns = "ward.D2",
              clustering_distance_columns = "spearman",
              cluster_rows = F, cluster_columns = T,
              show_row_names = F, show_column_names = F, top_annotation = ha,
              column_title_rot = 45,
              column_dend_height = unit(3, "mm"),
              use_raster = F,
              heatmap_width = unit(55, "mm"),
              column_title_gp = gpar(fontsize = 9),
              border = T,
              border_gp = gpar(lwd = 0.5),
              column_gap = unit(0, "mm"), show_heatmap_legend = F)
pdf(glue("{out_dir}/figS7B.pdf"), width = 8.6, height = 4.5)
ht0 <- draw(ht)
d <- dev.off()
draw(ht)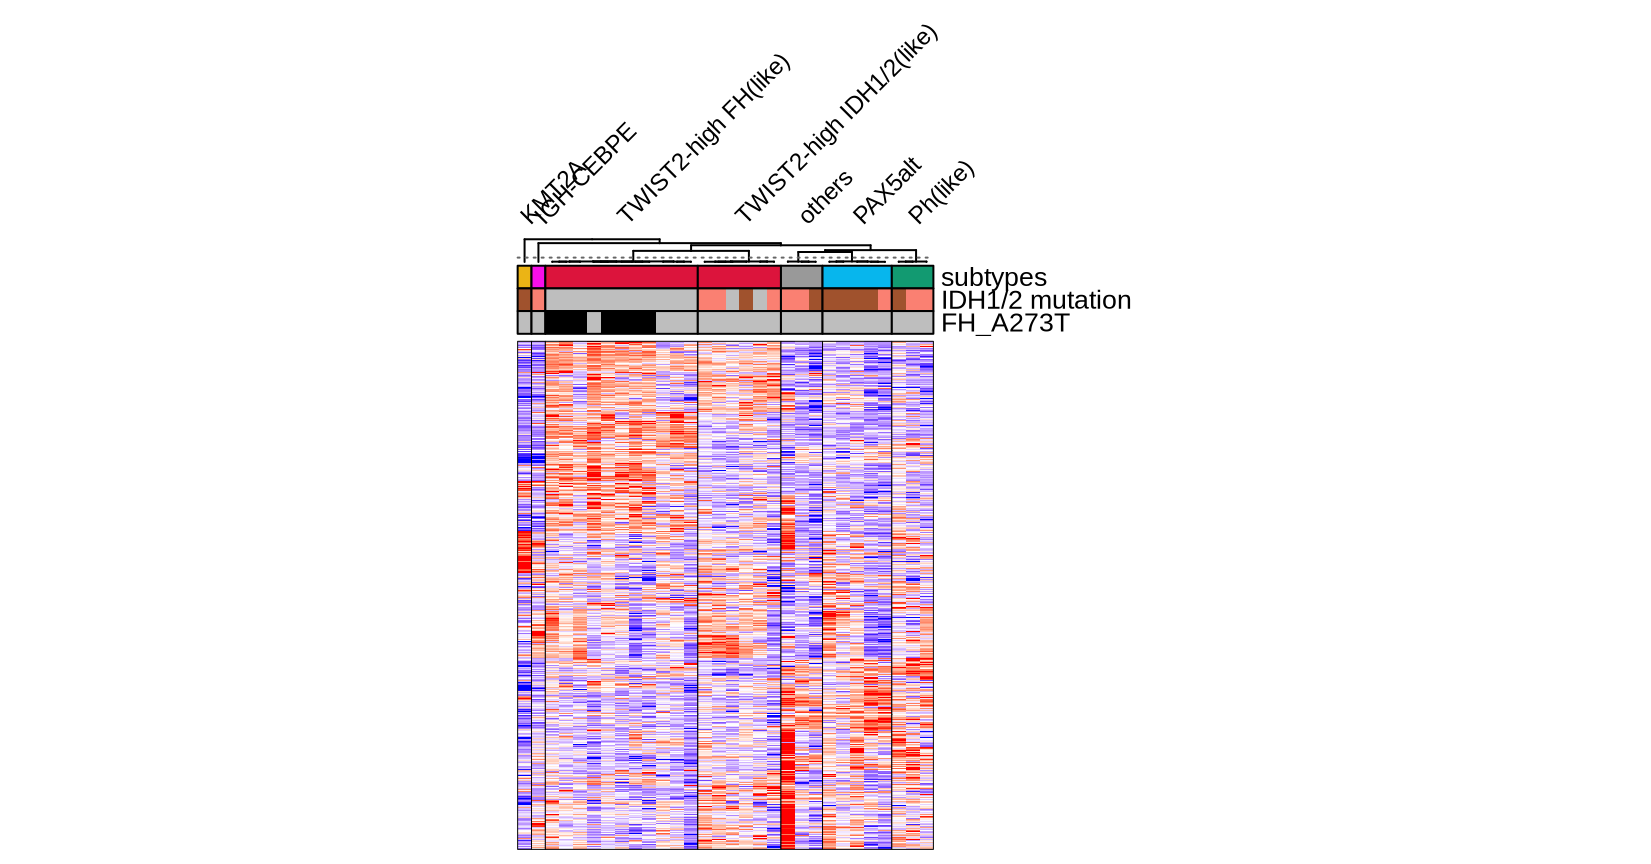
sup_figure7C
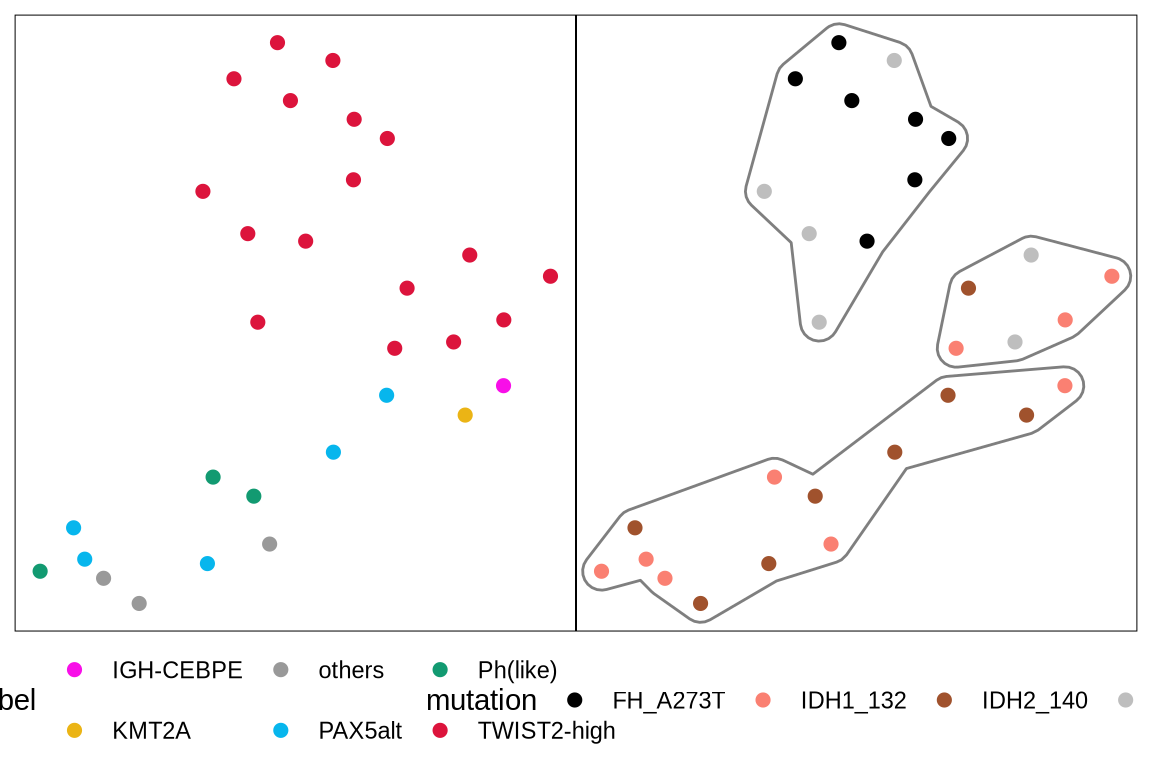
umpaf <- glue("{in_dir}/twist2_idh_umap.rds") %>% read_rds
group_color <-  glue("{in_dir}/group_color.rds") %>% read_rds
p1 <- umpaf %>%
  ggplot(aes(x = V1, y = V2, color = label)) +
  geom_point(size = 2) +
  scale_color_manual(values = group_color) +
  theme_void() +
  theme(legend.position = "bottom", panel.border = element_rect(fill = NA, colour = "black"))
p2 <- umpaf %>%
  ggplot(aes(x = V1, y = V2, color = mutation)) +
  geom_point(size = 2) +
  ggforce::geom_mark_hull(data = umpaf, mapping = aes(color = label3), expand = unit(2.5, "mm"))+
  theme_void()+
  scale_color_manual(values = c("no mutation" = "grey", "IDH1_132" = "#FA8072","IDH2_140" = "#A0522D","FH_A273T" = "black")) +
  theme(legend.position = "bottom", panel.border = element_rect(fill = NA, colour = "black"))
pdf(glue("{out_dir}/figS7C.pdf"),width = 6,height = 4)
print(p1 + p2)
d <- dev.off()
print(p1 + p2)