pkgs <- c("ggthemes", "jhtools", "glue", "ggsci", "patchwork", "tidyverse",
          "circlize", "ComplexHeatmap", "SummarizedExperiment", "jhuanglabRNAseq",
          "viridis","ggrepel", "tidygraph","ggraph")
for (pkg in pkgs){
  suppressPackageStartupMessages(library(pkg, character.only = T))
}
out_dir <- "./results/sup_figure3" %>% checkdir
in_dir <- "./data" %>% checkdirsup_figure3
sup_figure3A-1
umap_frame <- glue("{in_dir}/predict_umap.rds") %>% read_rds
umap_label_frame <- glue("{in_dir}/umap_label_frame.rds") %>% read_rds
subcod <- glue("{in_dir}/subcod.rds") %>% read_rds
umap_frame <-umap_frame %>%
        dplyr::filter(sub_groups != "others")
a <- ggplot(umap_frame, aes(x = V1, y = V2, color = Score)) +
  geom_point(size = 0.5) +
  theme_void() +
  theme(legend.justification = c(0,0),
        legend.position = c(0,0),
        legend.direction = "horizontal",
        legend.key.width = unit(5, "mm"),
        legend.key.height = unit(3.5, "mm"),
        legend.title = element_text(hjust = 1, vjust = 1))  +
  scale_color_viridis_c(
    guide = guide_colourbar(
      title = "Confidence",
      direction = "horizontal",
      title.position = "top",
      label.position = "bottom",
      barwidth = unit(25, "mm"))
  ) +
  geom_text_repel(data = umap_label_frame %>%
                    dplyr::filter(sub_groups != "others") %>%
                    dplyr::filter(!sub_groups %in% subcod),
                  mapping = aes(x = x, y = y, label = sub_groups), color = "black",size = 3,
                  max.overlaps = 100000) +
  geom_rect(xmin = 3.4, xmax = 5.3, ymin = -1.3, ymax = 0.026,
            fill = NA, linewidth = 0.5, color = "red", linetype = "dashed")

pdf(glue("{out_dir}/figS3A1.pdf"), width = 4, height = 3.5)
print(a)
dev.off()
png
2 a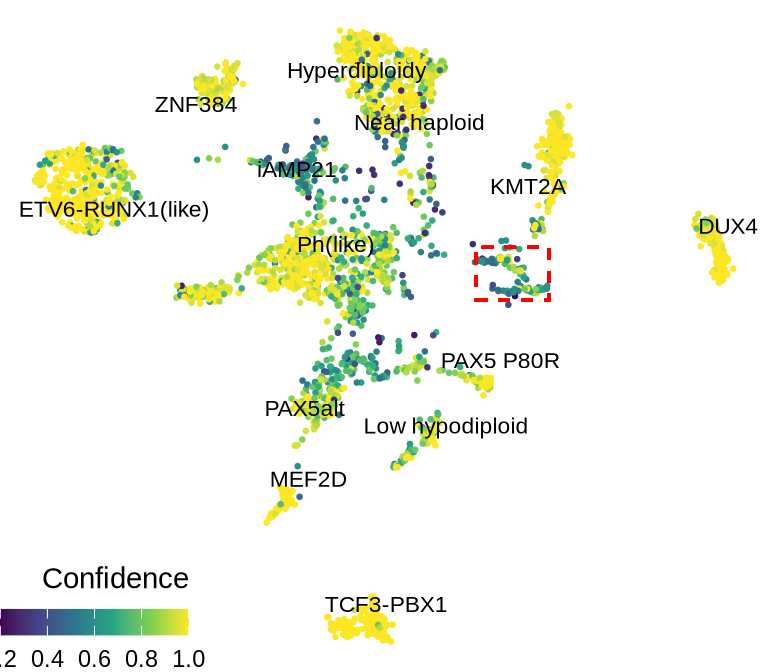
sup_figure3A-2
umap_label_frame_sub <- glue("{in_dir}/umap_label_frame_sub.rds") %>% read_rds
subcod <- glue("{in_dir}/subcod.rds") %>% read_rds
group_color <- glue("{in_dir}/group_color.rds") %>% read_rds
umap_frame <- umap_frame %>%
        dplyr::filter(sub_groups %in% subcod) %>%
        dplyr::filter(V1 > 2.3)
a <- ggplot(umap_frame, aes(x = V1, y = V2, color = Score)) +
  scale_color_viridis_c() +
  geom_point(data = umap_frame %>%
               dplyr::filter(sub_groups != "others") %>%
               dplyr::filter(V1 > 3.4 & V1 < 5.3 & V2 > -1.3 & V2 < 0.026) %>%
               dplyr::filter(!sub_groups %in% subcod),size = 0.3) +
  ggforce::geom_mark_ellipse(aes(fill = sub_groups),
                    color = NA,
                    expand = unit(1, "mm")) +
  scale_fill_manual(values = group_color) +
  geom_point(size = 0.3) +
  theme_void() +
  theme(legend.position = "none")+
  geom_text_repel(data = umap_label_frame_sub,
                  mapping = aes(x = x, y = y, label = sub_groups), color = "black",size = 1,
                  max.overlaps = 100)
pdf(glue("{out_dir}/figS3A2.pdf"), width = 1.4, height = 1.2)
print(a)
d <- dev.off()
a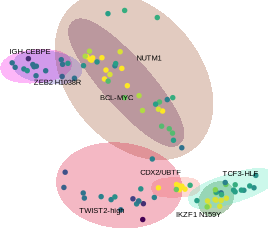
sup_figure3B
plt <- glue("{in_dir}/predict_point.rds") %>% read_rds
totalcod <- glue("{in_dir}/twist2_idh_colod.rds") %>% read_rds
prediction_level <- glue("{in_dir}/prediction_level.rds") %>% read_rds
pp <- plt %>%
  dplyr::filter(sample_label != "others") %>%
  mutate(sample_label = factor(sample_label, levels = totalcod),
         Prediction = factor(Prediction, levels = prediction_level))
a <- ggplot(pp, aes(x = Prediction, y = sample_label, size = score, color = pct)) +
  geom_point() +
  scale_color_gradientn(values = c(0, 0.7, 1),
                        colours = c("grey95","grey85","red"),
                        guide = guide_colorbar(
                          barwidth = 0.7
                        ))+
  xlab(label = "Prediction") +
  ylab("Real") +
  scale_size_area(max_size = 2) +
  theme_few() +
  theme(axis.text.x = element_text(angle = 90, hjust = 1, vjust = 0.5),
        axis.text = element_text(size = 7, color = "black"),
        axis.title = element_text(size = 7, color = "black"),
        legend.box.margin = margin(0,0,0,0),
        legend.box.spacing = unit(1, "mm"),
        legend.key.width = unit(0.7, "mm"),
        legend.key.height = unit(3.5, "mm"),
        legend.text = element_text(size = 7),
        legend.title = element_text(size = 7),
        legend.spacing = unit(0, 'cm'),
        legend.margin = margin(0,0,0,0),
        panel.border = element_rect(colour = "black"),
        axis.ticks = element_line(linewidth = 0.4, colour = "black")) +
  coord_cartesian(clip = "on")
pdf(glue("{out_dir}/figS3B.pdf"), width = 3.4, height = 3.5)
print(a)
d <- dev.off()
a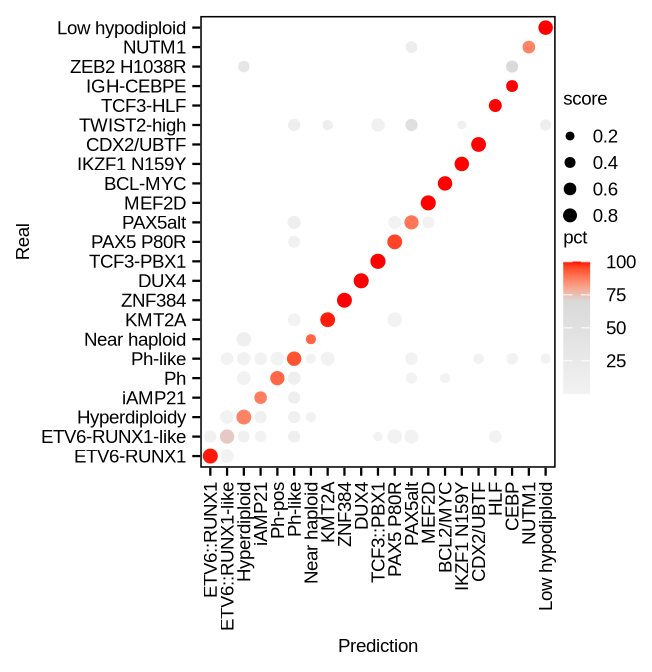
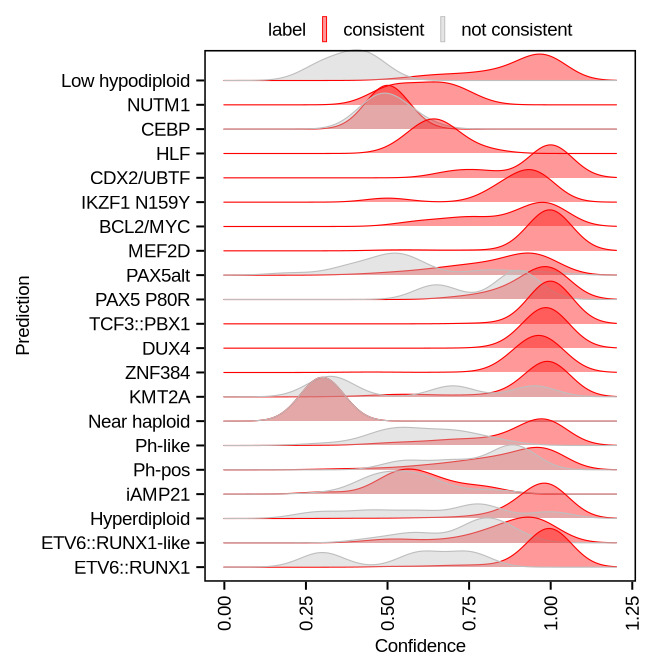
sup_figure3C
full_density <- glue("{in_dir}/predict_density.rds") %>% read_rds
rdp <- full_density %>%
  ggplot(aes(x = Score, y = Prediction, fill = label, color = label)) +
  ggridges::geom_density_ridges(alpha = 0.4, linewidth = 0.2) +
  scale_fill_manual(values = c("consistent" = "red", "not consistent" = "grey")) +
  scale_color_manual(values = c("consistent" = "red", "not consistent" = "grey")) +
  xlab(label = "Confidence") +
  ylab(label = "Prediction") +
  theme_few() +
  theme(axis.text.x = element_text(angle = 90, hjust = 1, vjust = 0.5),
        axis.text = element_text(size = 7, color = "black"),
        axis.title.y = element_text(size = 7, color = "black"),
        axis.title.x = element_text(size = 7, color = "black"),
        axis.ticks = element_line(linewidth = 0.35, colour = "black"),
        legend.box.margin = margin(0,0,0,0),
        legend.box.spacing = unit(1, "mm"),

        legend.key.width = unit(0.7, "mm"),
        legend.key.height = unit(3.5, "mm"),
        legend.text = element_text(size = 7),
        legend.title = element_text(size = 7),
        legend.spacing = unit(0, 'cm'),
        legend.margin = margin(0,0,0,0),

        legend.position = "top",

        panel.border = element_rect(colour = "black"))
pdf(glue("{out_dir}/figS3C.pdf"), width = 3.4, height = 3.5)
print(rdp)
d <- dev.off()
rdp