pkgs <- c("ggthemes", "jhtools", "glue", "ggsci", "patchwork", "tidyverse",
          "circlize", "ComplexHeatmap", "SummarizedExperiment", "jhuanglabRNAseq",
          "viridis","ggrepel", "tidygraph","ggraph")
for (pkg in pkgs){
  suppressPackageStartupMessages(library(pkg, character.only = T))
}
out_dir <- "./results/sup_figure2" %>% checkdir
in_dir <- "./data" %>% checkdirsup_figure2
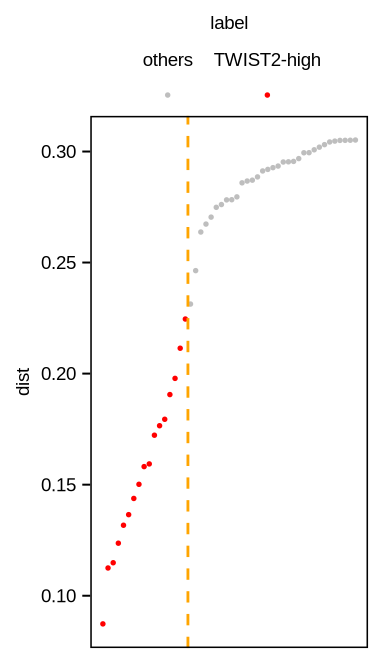
sup_figure2A
pointf<- glue("{in_dir}/similiary_point.rds") %>% read_rds
elbow <- pointf %>%
  ggplot(aes(x = index, y = dist, color = color_label)) +
  geom_point(size = 0.3)+
  geom_vline(xintercept = 18.5, linetype = "dashed", color = "orange") +
  scale_color_manual(values = c("TWIST2-high" = "red", "others" = "grey"),
                     guide = guide_legend(
                       title = "label",
                       direction = "horizontal",
                       title.position = "top",
                       label.position = "top",
                       axis.linewidth = NA,
                       keywidth = unit(8, "mm"))) +
  theme_few() +
  theme(axis.text.x = element_blank(),
        axis.text = element_text(size = 7, color = "black"),
        axis.title.y = element_text(size = 7, color = "black"),
        axis.title.x = element_blank(),
        axis.ticks.y = element_line(linewidth = 0.35, colour = "black"),
        axis.ticks.x = element_blank(),
        legend.box.margin = margin(0,0,0,0),
        legend.box.spacing = unit(1, "mm"),
        legend.key.width = unit(0.7, "mm"),
        legend.key.height = unit(3.5, "mm"),
        legend.text = element_text(size = 7),
        legend.spacing = unit(0, 'cm'),
        legend.margin = margin(0,0,0,0),
        legend.title = element_text(hjust = 0.5, vjust = 1, size = 7),
        legend.position = "top",
        panel.border = element_rect(colour = "black"))
pdf(glue("{out_dir}/figS2A.pdf"), width = 2, height = 3.5)
print(elbow)
dev.off()
png
2 elbow
sup_figure2B
pointf<- glue("{in_dir}/similiary_point.rds") %>% read_rds
elbow <- pointf %>%
  ggplot(aes(x = index, y = dist, color = color_label)) +
  geom_point(size = 0.3)+
  geom_vline(xintercept = 18.5, linetype = "dashed", color = "orange") +
  scale_color_manual(values = c("TWIST2-high" = "red", "others" = "grey"),
                     guide = guide_legend(
                       title = "label",
                       direction = "horizontal",
                       title.position = "top",
                       label.position = "top",
                       axis.linewidth = NA,
                       keywidth = unit(8, "mm"))) +
  theme_few() +
  theme(axis.text.x = element_blank(),
        axis.text = element_text(size = 7, color = "black"),
        axis.title.y = element_text(size = 7, color = "black"),
        axis.title.x = element_blank(),
        axis.ticks.y = element_line(linewidth = 0.35, colour = "black"),
        axis.ticks.x = element_blank(),
        legend.box.margin = margin(0,0,0,0),
        legend.box.spacing = unit(1, "mm"),
        legend.key.width = unit(0.7, "mm"),
        legend.key.height = unit(3.5, "mm"),
        legend.text = element_text(size = 7),
        legend.spacing = unit(0, 'cm'),
        legend.margin = margin(0,0,0,0),
        legend.title = element_text(hjust = 0.5, vjust = 1, size = 7),
        legend.position = "top",
        panel.border = element_rect(colour = "black"))
pdf(glue("{out_dir}/figS2A.pdf"), width = 2, height = 3.5)
print(elbow)
d <- dev.off()
elbow