pkgs <- c("ggthemes", "jhtools", "glue", "ggsci", "patchwork", "tidyverse",
          "circlize", "ComplexHeatmap", "SummarizedExperiment", "jhuanglabRNAseq",
          "viridis","ggrepel", "tidygraph","ggraph")
for (pkg in pkgs){
  suppressPackageStartupMessages(library(pkg, character.only = T))
}
out_dir <- "./results/sup_figure11" %>% checkdir
in_dir <- "./data" %>% checkdirsup_figure11
sup_figure11A
FGF_score <- glue("{in_dir}/FGF_score.rds") %>% read_rds()
p <- ggplot(FGF_score,
            aes(x = sample_label, y = name, fill = value)) +
  geom_tile() +
  scale_fill_gradient2(low = "blue", high = "red") +
  theme_few() +
  theme(axis.text.x = element_text(angle = 90, hjust = 1, vjust = 0.5)) +
  theme(legend.position = "none",
        axis.title = element_blank(),
        axis.text = element_text(size = 7, colour = "black"),
        axis.ticks = element_line(linewidth = 0.1, colour = "black"),
        axis.ticks.length = unit(0.05, "lines"),

        legend.box.margin = margin(0,0,0,0),
        legend.box.spacing = unit(1.5, "mm"))

pdf(glue("{out_dir}/figS11A.pdf"), width = 3.5, height = 5)
print(p)
d <- dev.off()
p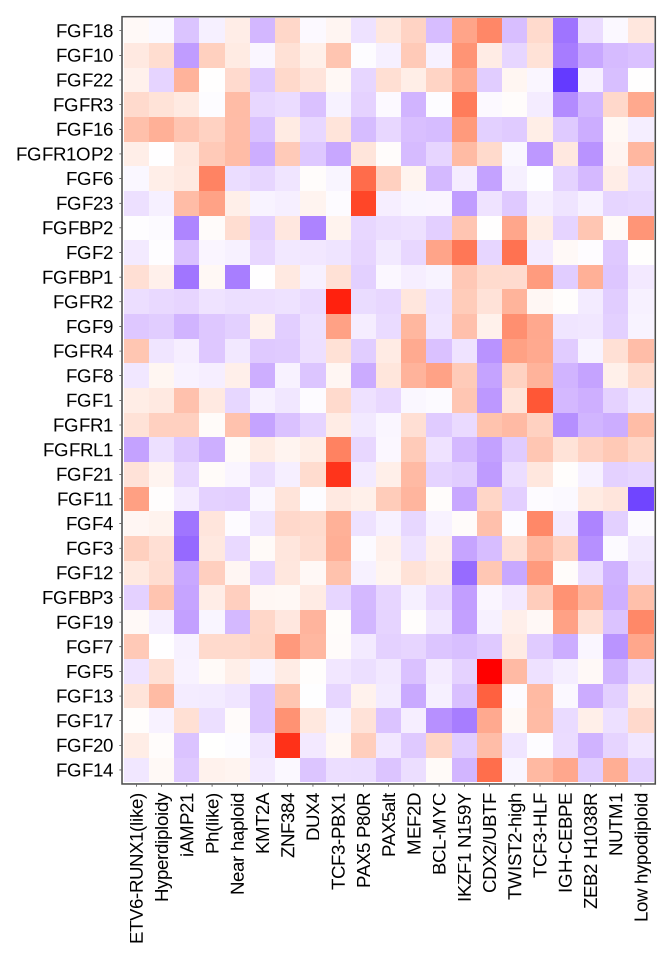
sup_figure11BC
TRIGLYCERIDE <- glue("{in_dir}/TRIGLYCERIDE_score.rds") %>% read_rds()

p <- ggplot(TRIGLYCERIDE$REACTOME_TRIGLYCERIDE_METABOLISM,
            aes(x = sample_label, y = name, fill = value)) +
  geom_tile() +
  scale_fill_gradient2(low = "blue", high = "red") +
  theme_few() +
  theme(axis.text.x = element_text(angle = 90, hjust = 1, vjust = 0.5)) +
  theme(legend.position = "none",
        axis.title = element_blank(),
        axis.text = element_text(size = 7, colour = "black"),
        axis.ticks = element_line(linewidth = 0.1, colour = "black"),
        axis.ticks.length = unit(0.05, "lines"),

        legend.box.margin = margin(0,0,0,0),
        legend.box.spacing = unit(1.5, "mm"))

pdf(glue("{out_dir}/figS11B.pdf"), width = 3.5, height = 2)
print(p)
d <- dev.off()
p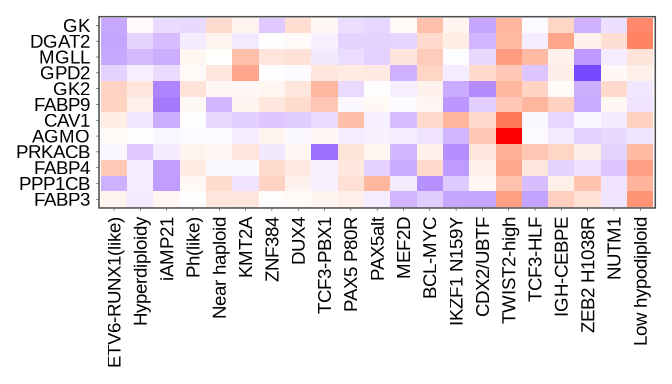
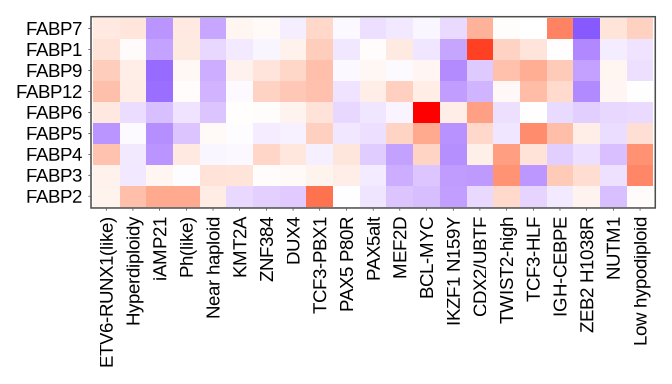
sup_figure11D
FABP_score <- glue("{in_dir}/FABP_score.rds") %>% read_rds()
p <- ggplot(FABP_score,
            aes(x = sample_label, y = name, fill = value)) +
  geom_tile() +
  scale_fill_gradient2(low = "blue", high = "red") +
  theme_few() +
  theme(axis.text.x = element_text(angle = 90, hjust = 1, vjust = 0.5)) +
  theme(legend.position = "none",
        axis.title = element_blank(),
        axis.text = element_text(size = 7, colour = "black"),
        axis.ticks = element_line(linewidth = 0.1, colour = "black"),
        axis.ticks.length = unit(0.05, "lines"),

        legend.box.margin = margin(0,0,0,0),
        legend.box.spacing = unit(1.5, "mm"))
pdf(glue("{out_dir}/figS11D.pdf"), width = 3.5, height = 2)
print(p)
d <- dev.off()
p