pkgs <- c("ggthemes", "jhtools", "glue", "ggsci", "patchwork", "tidyverse",
          "circlize", "ComplexHeatmap", "SummarizedExperiment", "jhuanglabRNAseq",
          "viridis","ggrepel", "tidygraph","ggraph")
for (pkg in pkgs){
  suppressPackageStartupMessages(library(pkg, character.only = T))
}
out_dir <- "./results/figure4" %>% checkdir
in_dir <- "./data" %>% checkdirfigure4
figure4A
ssgsea_metabolism <- read_rds(glue("{in_dir}/ssgsea_metabolism.rds"))
a <- ggplot(ssgsea_metabolism,aes(x = sub_types, y = gene_set %>% str_replace_all("_", " ") %>% str_wrap(width = 30),
                   fill = value)) +
    geom_tile() +
    scale_fill_gradient2(low = "blue", high = "red",
                         guide = guide_colourbar(label.hjust = 0.5)) +
    theme_few() +
    theme(
      axis.text.x = element_text(angle = 90, hjust = 1, vjust = 0.5, colour = "black"),
      axis.text = element_text(size = 6, colour = "black"),
      axis.ticks = element_line(linewidth = 0.2, colour = "black"),
      axis.ticks.length = unit(0.05, "lines"),
      axis.title = element_blank(),
      legend.box.margin = margin(0,0,0,0),
      legend.box.spacing = unit(1.5, "mm"),
      legend.key.width = unit(2, "mm"),
      legend.key.height = unit(2, "mm"),
      legend.text = element_text(size = 7),
      legend.title = element_text(size = 7),
      legend.ticks.length = unit(0.1, "lines"),
      panel.border = element_rect(colour = "black", linewidth = 0.3)
)
pdf(glue("{out_dir}/figure4A.pdf"), width = 4.5, height = 2.5)
print(a)
d <- dev.off()
a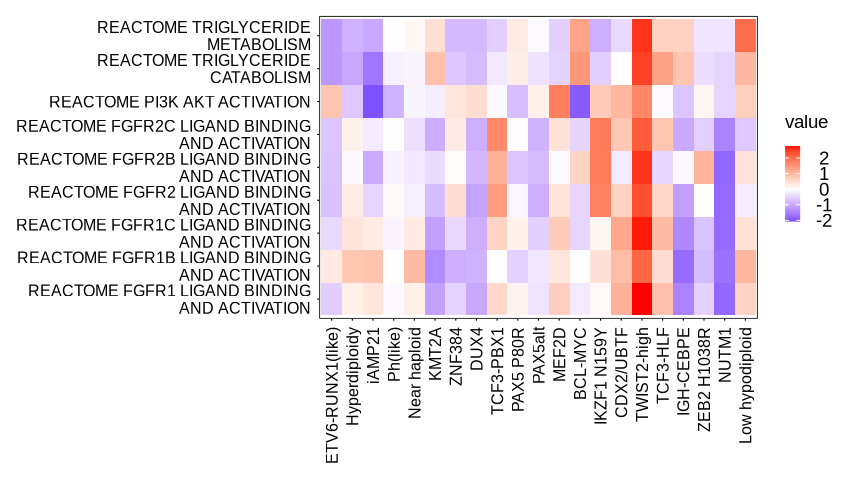
figure4B-1
bigcod <- glue("{in_dir}/bigcod.rds") %>% read_rds
group_color <- glue("{in_dir}/group_color.rds") %>% read_rds
scaled_wd_heatmap <- glue("{in_dir}/immue_big_matrix.rds") %>% read_rds
immue_big_anno <- glue("{in_dir}/immue_big_anno.rds") %>% read_rds
ha <- HeatmapAnnotation(
  sub_groups = immue_big_anno,
  col = list(
    sub_groups = group_color
  ),
  simple_anno_size = unit(1.8, "mm"),
  border = F,
  show_legend = F,
  show_annotation_name = F
)
a <- Heatmap(scaled_wd_heatmap,
              column_split = factor(immue_big_anno, levels = bigcod),
              clustering_method_columns = "ward.D2",
              clustering_distance_columns = "spearman",
              cluster_rows = F, cluster_columns = F,
              show_row_names = T, show_column_names = F,
              row_names_gp = gpar(fontsize = 6),
              top_annotation = ha,
              column_title_rot = 45,
              use_raster = F,
              column_title_gp = gpar(fontsize = 9),
              border = T,
              border_gp = gpar(lwd = 0.5),
              column_gap = unit(0, "mm"), show_heatmap_legend = F)
pdf(glue("{out_dir}/figure4B1.pdf"), width = 5.36, height = 4.5)
print(a)
d <- dev.off()
a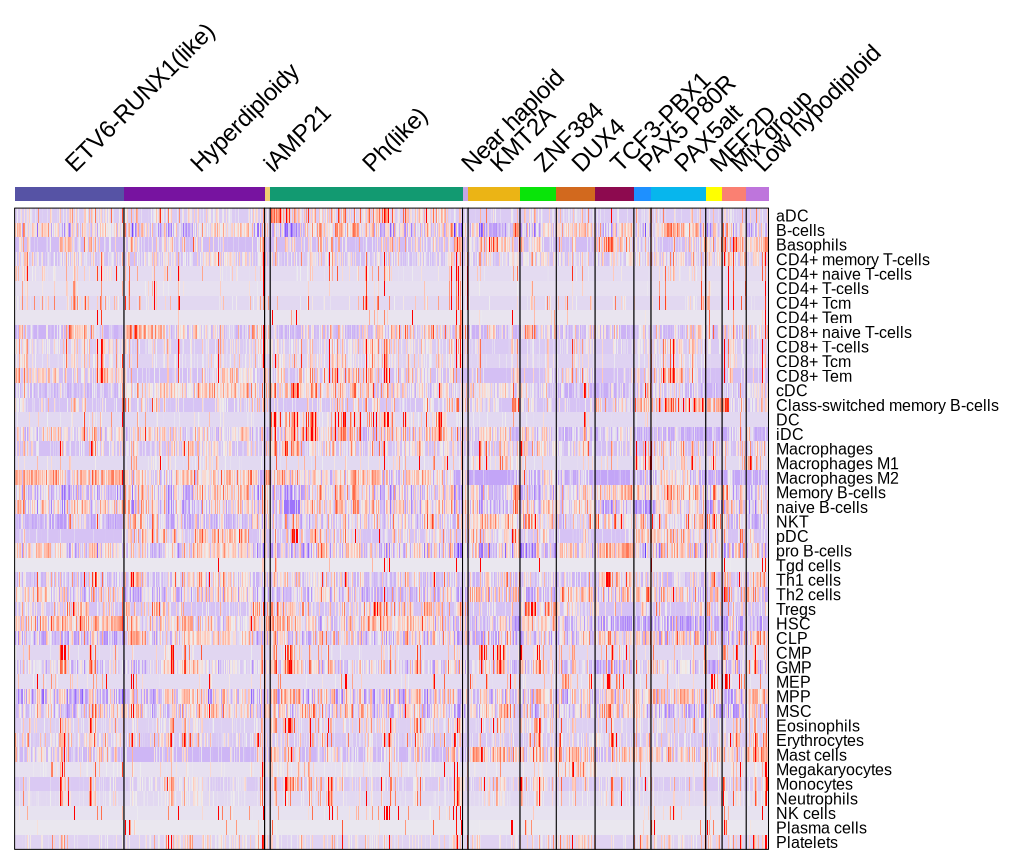
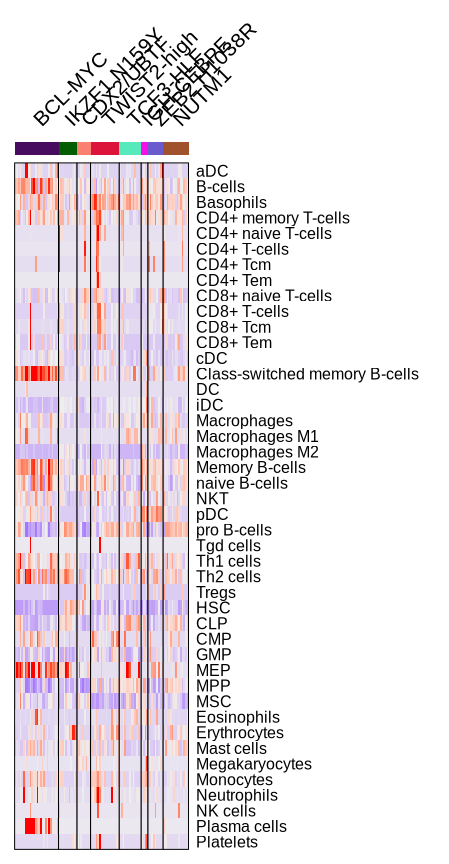
figure4B-2
group_color <- glue("{in_dir}/group_color.rds") %>% read_rds
sub_scaled_wd_heatmap <- glue("{in_dir}/immue_sub_matrix.rds") %>% read_rds
subv <- glue("{in_dir}/immue_sub_anno.rds") %>% read_rds
subcod <- glue("{in_dir}/subcod.rds") %>% read_rds

sub_ha <- HeatmapAnnotation(
  sub_groups = subv,
  col = list(
    sub_groups = group_color
  ),
  simple_anno_size = unit(1.8, "mm"),
  border = F,
  show_legend = F,
  show_annotation_name = F
)
a <- Heatmap(sub_scaled_wd_heatmap,
              column_split = factor(subv, levels = subcod),
              clustering_method_columns = "ward.D2",
              clustering_distance_columns = "spearman",
              cluster_rows = F, cluster_columns = F,
              show_row_names = T, show_column_names = F,
              row_names_gp = gpar(fontsize = 6),
              top_annotation = sub_ha,
              column_title_rot = 45,
              use_raster = F,
              column_title_gp = gpar(fontsize = 8),
              border = T,
              border_gp = gpar(lwd = 0.5),
              column_gap = unit(0, "mm"), show_heatmap_legend = F)
pdf(glue("{out_dir}/figure4B2.pdf"), width = 2.34, height = 4.5)
print(a)
d <- dev.off()
a