pkgs <- c("ggthemes", "jhtools", "glue", "ggsci", "patchwork", "tidyverse",
          "circlize", "ComplexHeatmap", "SummarizedExperiment", "jhuanglabRNAseq",
          "viridis","ggrepel", "tidygraph","ggraph")
for (pkg in pkgs){
  suppressPackageStartupMessages(library(pkg, character.only = T))
}
out_dir <- "./results/figure1" %>% checkdir
in_dir <- "./data" %>% checkdirfigure1
figure1A-1
mx <-  glue("{in_dir}/raw_big_heatmap.rds") %>% read_rds
cluster_annotation <-  glue("{in_dir}/raw_big_heatmap_anno.rds") %>% read_rds
group_color <-  glue("{in_dir}/group_color.rds") %>% read_rds
bigcod <-  glue("{in_dir}/bigcod.rds") %>% read_rds
ft <- cluster_annotation$label != "others"
ha <- HeatmapAnnotation(
  label = cluster_annotation$biglabel[ft],
  col = list(
    label = group_color
  ),
  simple_anno_size = unit(1.8, "mm"),
  show_legend = F,
  show_annotation_name = F
)
ht <- Heatmap(t(mx)[,ft],
              column_split = factor(cluster_annotation$biglabel[ft], levels = bigcod),
              clustering_method_columns = "ward.D2",
              clustering_distance_columns = "spearman",
              cluster_rows = F, cluster_columns = T,
              show_row_names = F, show_column_names = F, top_annotation = ha,
              column_title_rot = 45,
              use_raster = F,
              heatmap_width = unit(200, "mm"),
              column_dend_height = unit(5, "mm"),
              column_title_gp = gpar(fontsize = 9),
              column_title = NULL,
              border = T,
              border_gp = gpar(lwd = 0.5),
              column_gap = unit(0, "mm"), show_heatmap_legend = F)
pdf(glue("{out_dir}/figure1A1.pdf"), width = 8.6, height = 2.5)
draw(ht)
d <- dev.off()
ht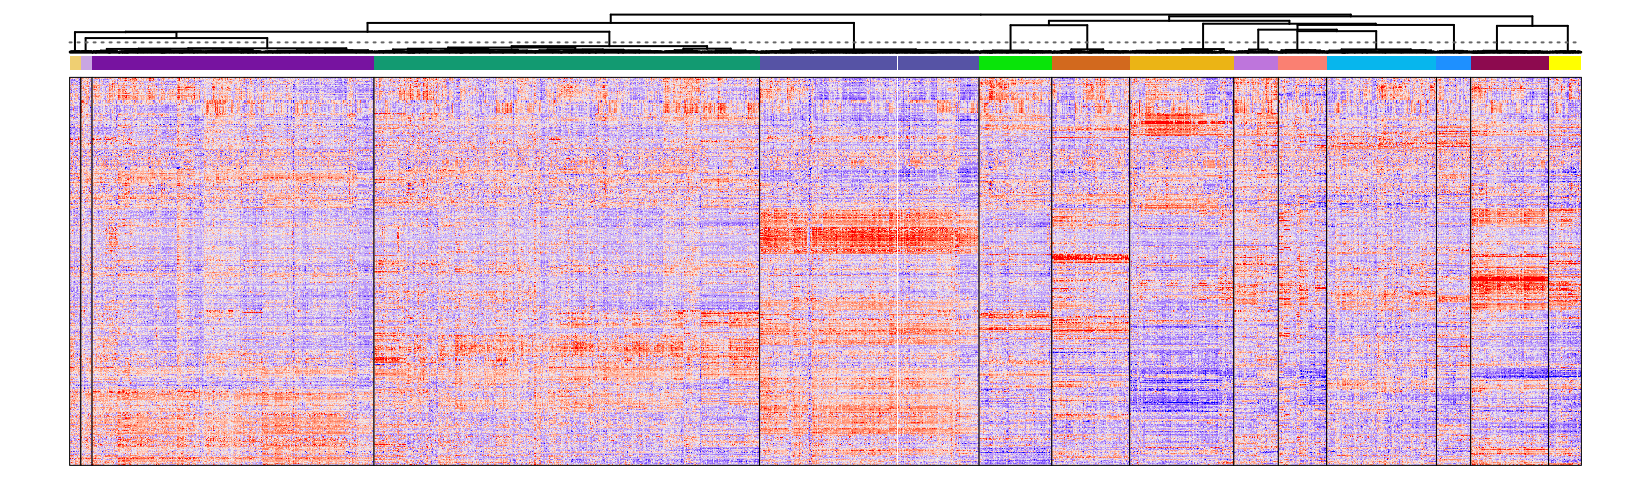
figure1A-2
mx2 <- read_rds(glue("{in_dir}/raw_sub_heatmap.rds"))
cluster_annotation2 <- read_rds(glue("{in_dir}/raw_subheatmap_anno.rds"))
colDendrogram <- read_rds(glue("{in_dir}/colDendrogram.rds"))
spv<- read_rds(glue("{in_dir}/raw_sub_ids.rds"))

ha2 <- HeatmapAnnotation(
  label = cluster_annotation2$label,
  IDH = cluster_annotation2$IDH,
  FH_A273T = cluster_annotation2$FH_A273T,
  col = list(
    label = group_color,
    IDH = c("IDH1_132" = "black", "IDH2_140" = "black"),
    FH_A273T = c("FH_A273T" = "black")
  ),
  simple_anno_size = unit(1.8, "mm"),
  annotation_name_gp =  grid::gpar(fontsize = 7),
  show_legend = F,
  show_annotation_name = T
)
ht <- Heatmap(t(mx2)[,spv],
              cluster_columns = colDendrogram,
              clustering_method_columns = "ward.D2",
              clustering_distance_columns = "pearson",
              cluster_rows = F,
              show_row_names = F, show_column_names = F, top_annotation = ha2,
              column_title_rot = 45,
              column_dend_height = unit(3, "mm"),
              heatmap_width = unit(50, "mm"),
              use_raster = F,
              column_title_gp = gpar(fontsize = 8.5),
              border = T,
              border_gp = gpar(lwd = 0.5),
              column_gap = unit(0, "mm"), show_heatmap_legend = F)
pdf(glue("{out_dir}/figure1A2.pdf"), width = 4, height = 3.5)
draw(ht)
d <- dev.off()
ht
figure1B-1
umap_frame <- glue("{in_dir}/umap_frame.rds") %>% read_rds()
umap_label_frame <- glue("{in_dir}/umap_label_frame.rds") %>% read_rds()
group_color <-  glue("{in_dir}/group_color.rds") %>% read_rds()
subcod <-  glue("{in_dir}/subcod.rds") %>% read_rds()
a <- umap_frame %>%
        dplyr::filter(sub_groups != "others") %>%
        ggplot(aes(x = V1, y = V2, color = sub_groups)) +
        geom_point(size = 0.5) +
        theme_void() +
        scale_color_manual(values = group_color) +
        theme(legend.position = "none") +
        geom_text_repel(data = umap_label_frame %>%
                          dplyr::filter(!sub_groups %in% subcod) %>%
                          dplyr::filter(sub_groups != "others"),
                        mapping = aes(x = x, y = y, label = sub_groups),
                        color = "black",size = 3,
                        max.overlaps = 1000)+
        geom_rect(xmin = 3.4, xmax = 5.3, ymin = -1.3, ymax = 0.026,
                  fill = NA, linewidth = 0.5, color = "red", linetype = "dashed")
pdf(glue("{out_dir}/figure1B1.pdf"), width = 4, height = 3.5)
print(a)
d <- dev.off()
a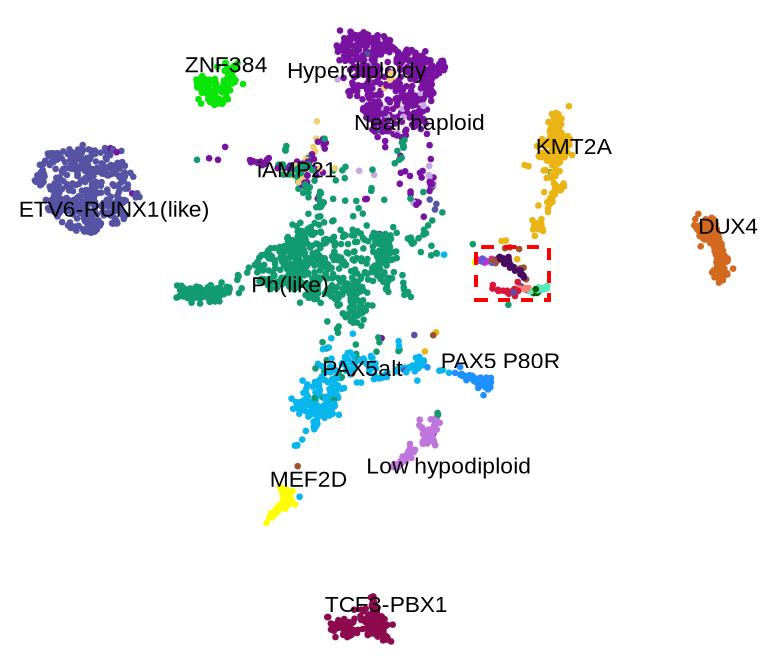
figure1B-2
umap_frame <- glue("{in_dir}/umap_frame.rds") %>% read_rds()
subcod <-  glue("{in_dir}/subcod.rds") %>% read_rds()
umap_label_frame_sub <- glue("{in_dir}/umap_label_frame_sub.rds") %>% read_rds()
group_color <-  glue("{in_dir}/group_color.rds") %>% read_rds
a <- umap_frame %>%
        dplyr::filter(sub_groups %in% subcod) %>%
        dplyr::filter(V1 > 2.3) %>%
        ggplot(aes(x = V1, y = V2, color = sub_groups)) +
        geom_point(size = 0.3) +
        theme_void() +
        scale_color_manual(values = group_color) +
        theme(legend.position = "none") +
        geom_text_repel(data = umap_label_frame_sub,
                        mapping = aes(x = x, y = y, label = sub_groups),
                        color = "black",size = 1.5,
                        max.overlaps = 100000)
pdf(glue("{out_dir}/figure1B2.pdf"), width = 3.5*0.4, height = 3*0.4)
print(a)
d <- dev.off()
a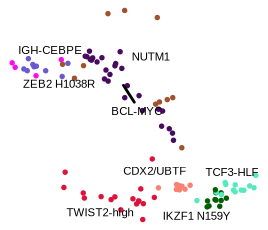
figure1C
boxplotdf <- glue("{in_dir}/boxplot_twist2.rds") %>% read_rds
group_color <-  glue("{in_dir}/group_color.rds") %>% read_rds
boxplotp <- boxplotdf %>%
  ggplot(aes(x = sub_groups, y = TWIST2, fill = sub_groups)) +
  geom_boxplot(outlier.size = 0.5) +
  scale_fill_manual(values = group_color) +
  theme_few() +
  ylab(label = "Expression level of TWIST2") +
  theme(
    axis.text.y = element_text(size = 5,colour = "black"),
    axis.text.x = element_text(size = 8, angle = 90, hjust = 1, vjust = 0.5,colour = "black"),
    axis.ticks = element_line(linewidth = 0.8,colour = "black"),
    axis.ticks.length = unit(0.05, "lines"),
    axis.title.x = element_blank(),
    axis.title.y = element_text(size = 8),
    legend.position = "none",

    panel.border = element_rect(colour = "black", linewidth = 1)
  )
pdf(glue("{out_dir}/figure1C.pdf"), width = 5, height = 2.5)
print(boxplotp)
d <- dev.off()
boxplotp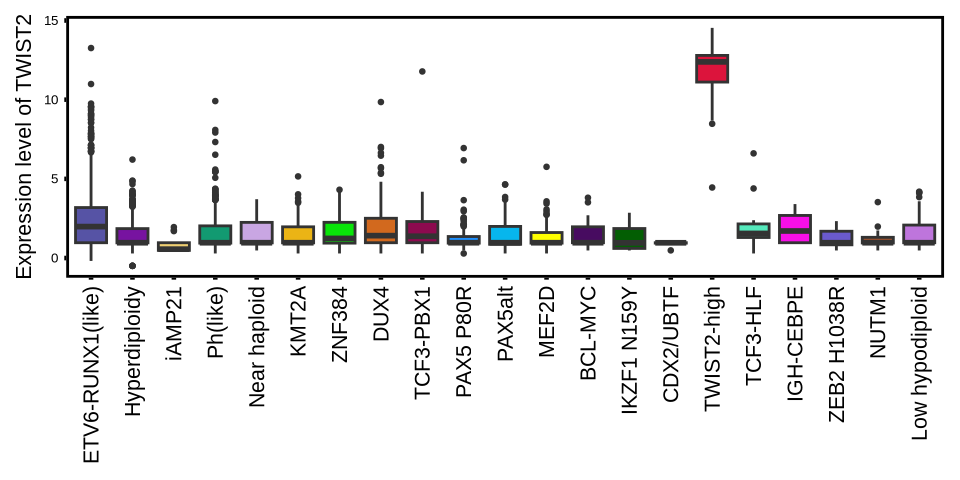
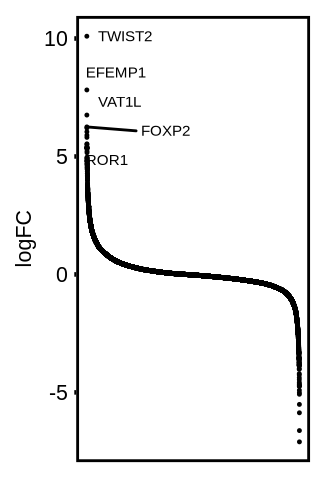
figure1D
full_rankframe <- glue("{in_dir}/generank_twist2.rds") %>% read_rds
group_color <-  glue("{in_dir}/group_color.rds") %>% read_rds

sub_rankframe <- full_rankframe %>% dplyr::filter(rank <= 5)
rank_plot <- ggplot(full_rankframe, aes(x = rank, y = logFC)) +
  geom_point(size = 0.2)+
  theme_few() +
  ylab(label = "logFC") +
  theme(
    axis.text.y = element_text(size = 8,colour = "black"),
    axis.text.x = element_blank(),
    axis.ticks.y = element_line(linewidth = 0.8,colour = "black"),
    axis.ticks.x = element_blank(),
    axis.ticks.length = unit(0.05, "lines"),
    axis.title.x = element_blank(),
    axis.title.y = element_text(size = 8),
    legend.position = "none",

    panel.border = element_rect(colour = "black", linewidth = 1)
  ) +
  geom_text_repel(data = sub_rankframe,
                  mapping = aes(label = gene),
                  color = "black",size = 2,
                  max.overlaps = 10)
pdf(glue("{out_dir}/figure1D.pdf"), width = 1.7, height = 2.5)
print(rank_plot)
d <- dev.off()
rank_plot