pkgs <- c("ggthemes", "jhtools", "glue", "ggsci", "patchwork", "tidyverse",
          "circlize", "ComplexHeatmap", "SummarizedExperiment", "jhuanglabRNAseq",
          "viridis","ggrepel", "tidygraph","ggraph")
for (pkg in pkgs){
  suppressPackageStartupMessages(library(pkg, character.only = T))
}
out_dir <- "./results/sup_figure1" %>% checkdir
in_dir <- "./data" %>% checkdirsup_figure1
sup_figure1A-1
group_color <-  glue("{in_dir}/group_color.rds") %>% read_rds
bigcod <-  glue("{in_dir}/bigcod.rds") %>% read_rds
scaled_wd_heatmap <- glue("{in_dir}/big_fusion_matrix.rds") %>% read_rds
big_fusion_anno <- glue("{in_dir}/big_fusion_anno.rds") %>% read_rds
rowv <- glue("{in_dir}/big_fusion_rowsp.rds") %>% read_rds
ha <- HeatmapAnnotation(
  sub_groups = big_fusion_anno,
  col = list(
    sub_groups = group_color
  ),
  border = F,
  simple_anno_size = unit(1.8, "mm"),
  show_legend = F,
  show_annotation_name = F
)
a <- Heatmap(scaled_wd_heatmap,
              col = c("TRUE" = "#f80fe8", "Loss" = "blue", "1" = "orange", "Gain" = "red"),
              na_col = "grey90",
              column_split = factor(big_fusion_anno, levels = bigcod),
              row_split = rowv,
              clustering_method_columns = "ward.D2",
              clustering_distance_columns = "spearman",
              cluster_rows = F, cluster_columns = F,
              show_row_names = T, show_column_names = F,
              row_names_gp = gpar(fontsize = 6),
              row_title = NULL,
              top_annotation = ha,
              column_title_rot = 45,
              use_raster = F,
              column_title_gp = gpar(fontsize = 9),
              border = T,
              border_gp = gpar(lwd = 0.5),
              column_gap = unit(0, "mm"), show_heatmap_legend = F)
pdf(glue("{out_dir}/figS1A1.pdf"), width = 6.7, height = 4.5)
print(a)
d <- dev.off()
a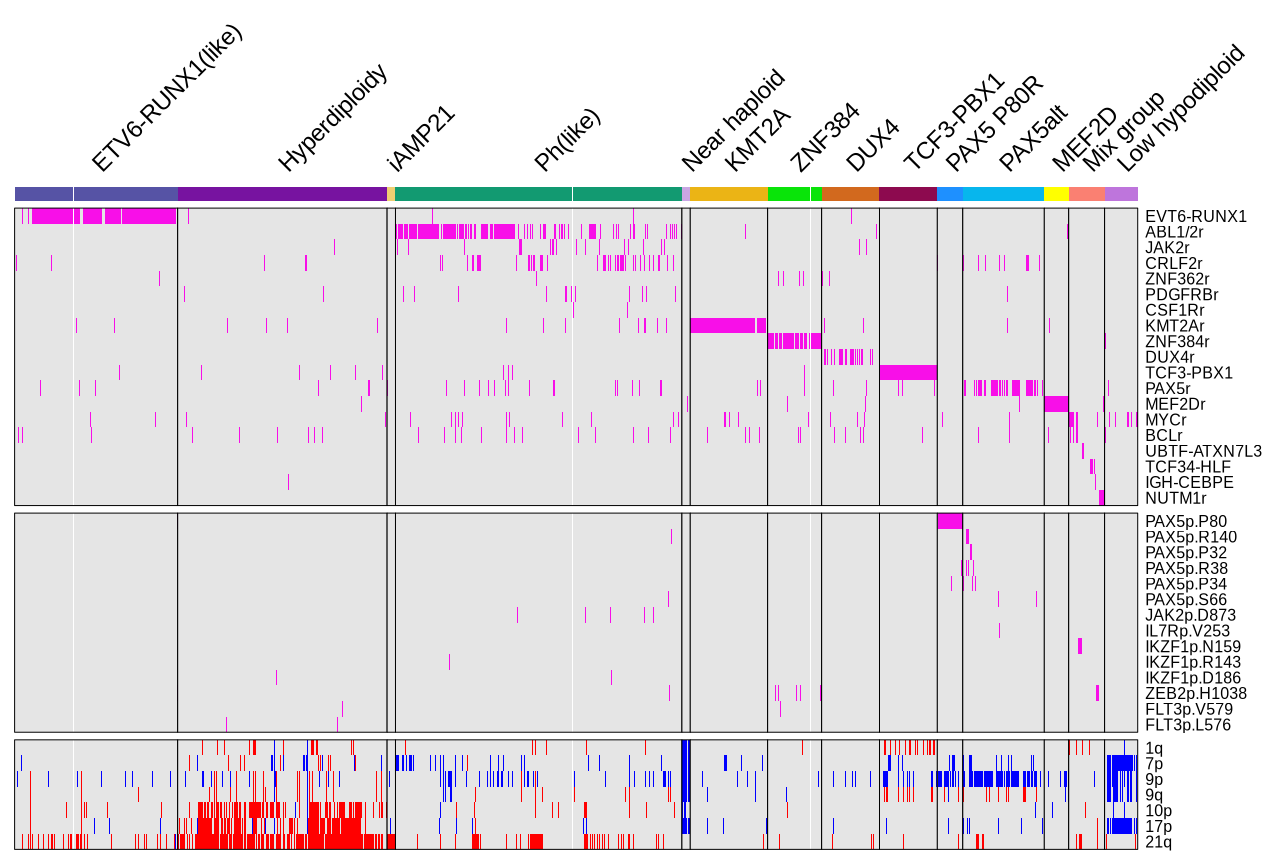
sup_figure1A-2
sub_scaled_wd_heatmap <- glue("{in_dir}/small_fusion_matrix.rds") %>% read_rds()
heatmap_ordereds <- glue("{in_dir}/small_fusion_anno.rds") %>% read_rds()
rowv_ft <- glue("{in_dir}/small_fusion_rowsp.rds") %>% read_rds()
group_color <-  glue("{in_dir}/group_color.rds") %>% read_rds
subcod <-  glue("{in_dir}/subcod.rds") %>% read_rds()
ha <- HeatmapAnnotation(
  sub_groups = heatmap_ordereds$sub_types,
  col = list(
    sub_groups = group_color
  ),
  simple_anno_size = unit(1.8, "mm"),
  border = F,
  show_legend = F,
  show_annotation_name = F
)
a <- Heatmap(sub_scaled_wd_heatmap,
              col = c("TRUE" = "#f80fe8", "Loss" = "blue", "1" = "orange", "Gain" = "red"),
              na_col = "grey90",
              column_split = factor(heatmap_ordereds$sub_types, levels = subcod),
              row_split = rowv_ft,
              clustering_method_columns = "ward.D2",
              clustering_distance_columns = "spearman",
              cluster_rows = F, cluster_columns = F,
              show_row_names = T, show_column_names = F,
              row_names_gp = gpar(fontsize = 6),
              row_title = NULL,
              top_annotation = ha,
              column_title_rot = 45,
              use_raster = F,
              column_title_gp = gpar(fontsize = 9),
              border = T,
              border_gp = gpar(lwd = 0.5),
              column_gap = unit(0, "mm"), show_heatmap_legend = F)
pdf(glue("{out_dir}/figS1A2.pdf"), width = 4, height = 4.5)
print(a)
d <- dev.off()
a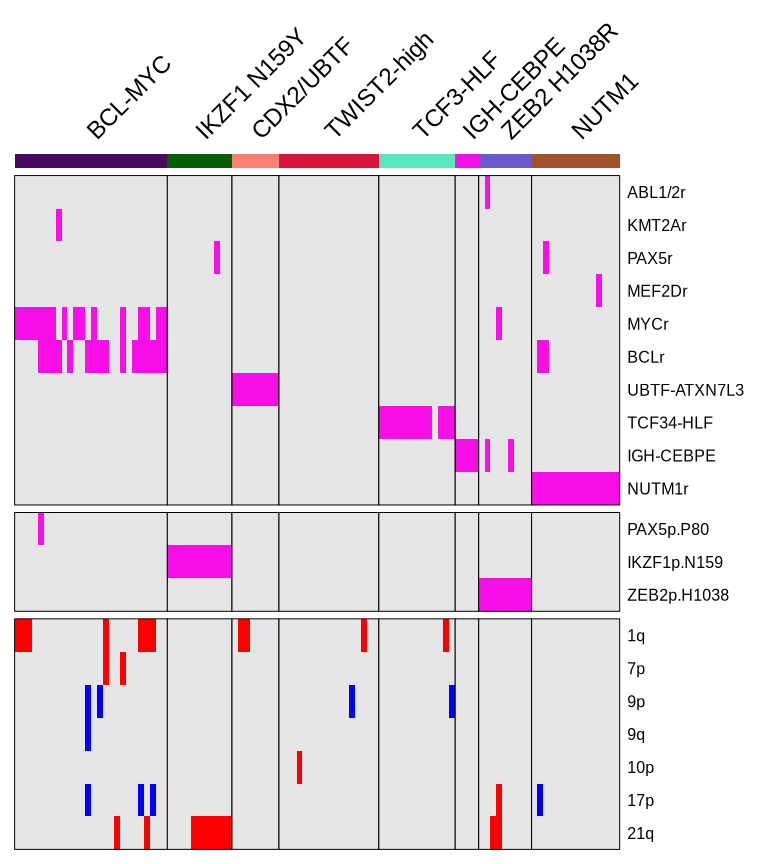
sup_figure1B-1
validdf <- read_rds(glue("{in_dir}/valid_newsamples.rds"))
umap_frame <- glue("{in_dir}/umap_frame.rds") %>% read_rds()
umap_label_frame <- glue("{in_dir}/umap_label_frame.rds") %>% read_rds()
group_color <-  glue("{in_dir}/group_color.rds") %>% read_rds()
subcod <-  glue("{in_dir}/subcod.rds") %>% read_rds()
a <- ggplot() +
      geom_point(data = umap_frame %>%
                     dplyr::filter(sub_groups != "others"),
                     mapping = aes(x = V1, y = V2, color = sub_groups), size = 1, alpha = 0.5, shape = 16) +
      geom_point(data = validdf, mapping = aes(x = V1, y = V2, color = sub_groups), size = 1, alpha = 1, shape = 3) +
      theme_void() +
      scale_color_manual(values = c("valid" = "#8B0000", group_color)) +
      theme(legend.position = "none") +
      geom_text_repel(data = umap_label_frame %>%
                        dplyr::filter(!sub_groups %in% subcod) %>%
                        dplyr::filter(sub_groups != "others"),
                      mapping = aes(x = x, y = y, label = sub_groups),
                      color = "black",size = 3,
                      max.overlaps = 1000)+
      geom_rect(xmin = 3.4, xmax = 5.3, ymin = -1.3, ymax = 0.026,
                fill = NA, linewidth = 0.5, color = "red", linetype = "dashed")
pdf(glue("{out_dir}/figS1B1.pdf"), width = 4, height = 3.5)
print(a)
d <- dev.off()
a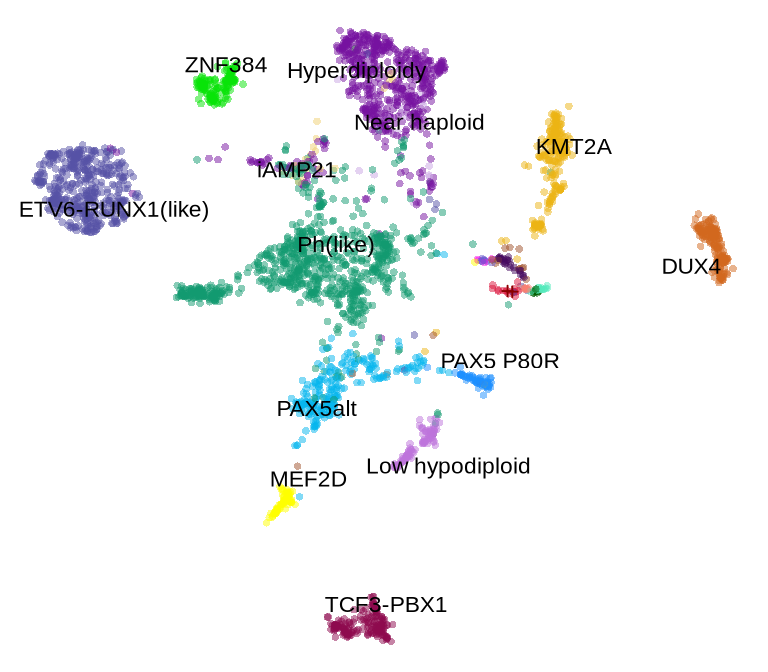
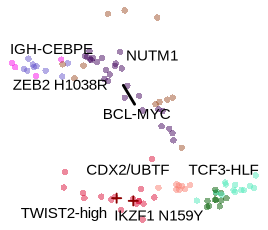
sup_figure1B-2
sub_validdf <-  glue("{in_dir}/valid_newsamples_zoom.rds") %>% read_rds
subcod <-  glue("{in_dir}/subcod.rds") %>% read_rds()
umap_label_framex <-  glue("{in_dir}/umap_label_frame_sub.rds") %>% read_rds()
a <- ggplot() +
        geom_point(data = umap_frame %>%
                     dplyr::filter(sub_groups %in% subcod) %>%
                     dplyr::filter(V1 > 2.3),
                   mapping = aes(x = V1, y = V2, color = sub_groups), size = 0.8, alpha = 0.5, shape = 16) +
        geom_point(data = sub_validdf, mapping = aes(x = V1, y = V2, color = sub_groups), size = 0.8, alpha = 1, shape = 3) +
        theme_void() +
        scale_color_manual(values = c("valid" = "#8B0000", group_color)) +
        theme(legend.position = "none") +
        geom_text_repel(data = umap_label_framex,
                        mapping = aes(x = x, y = y, label = sub_groups),
                        color = "black",size = 2,
                        max.overlaps = 100000)
pdf(glue("{out_dir}/figS1B2.pdf"), width = 1.4, height = 1.2)
print(a)
d <- dev.off()
a