pkgs <- c("ggthemes", "jhtools", "glue", "ggsci", "patchwork", "tidyverse",
          "circlize", "ComplexHeatmap", "SummarizedExperiment", "jhuanglabRNAseq",
          "viridis","ggrepel", "tidygraph","ggraph")
for (pkg in pkgs){
  suppressPackageStartupMessages(library(pkg, character.only = T))
}
out_dir <- "./results/sup_figure456" %>% checkdir
in_dir <- "./data" %>% checkdirsup_figure456
sup_figure4
agsuzhou_zhanglin_BL125.snp <- read_rds(glue("{in_dir}/varscan.snp.rds"))
a <- agsuzhou_zhanglin_BL125.snp %>%
  ggplot() +
  geom_density(data = . %>% dplyr::filter(somatic_status != "Unknown"),
               mapping = aes(x = position, fill = somatic_status), alpha = 0.2, linewidth = 0.2) +
  geom_vline(data =
               tibble(
                 chrom = c(paste0("chr", 1:22), "chrX", "chrY"),
                 position = c(123435318, 94362040, 91169345, 49892850, 49156541, 60172198, 60186171, 45255268, 43695248, 53488381, 53576500, 35470568, 17755192, 17247124, 19160798, 37007677, 25205468, 18665981, 26346405, 28342188, 12035514, 15283703, 61077972, 10489856)
               )%>% mutate(chrom = factor(chrom, levels = c(paste0("chr", 1:22), "chrX", "chrY"))),
             mapping = aes(xintercept = position), color = "orange", linewidth = 0.2) +
  geom_vline(data =
               tibble(
                 chrom = c(paste0("chr", 1:22), "chrX", "chrY"),
                 position = c(999, 999, 999, 999, 999, 999, 999, 999, 999, 999, 999, 999, 999, 999, 999, 999, 999, 999, 999, 999, 999, 999, 999, 999)
               )%>% mutate(chrom = factor(chrom, levels = c(paste0("chr", 1:22), "chrX", "chrY"))),
             mapping = aes(xintercept = position), color = "black", linewidth = 0.2) +
  geom_vline(data =
               tibble(
                 chrom = c(paste0("chr", 1:22), "chrX", "chrY"),
                 position = c(248955422, 242192529, 198294559, 190213555, 181537259, 170804979, 159344973, 145137636, 138393717, 133796422, 135085622, 133274309, 114363328, 107042718, 101990189, 90337345, 83256441, 80372285, 58616616, 64443167, 46708983, 50817468, 156039895, 57226415)
               ) %>% mutate(chrom = factor(chrom, levels = c(paste0("chr", 1:22), "chrX", "chrY"))),
             mapping = aes(xintercept = position), color = "black", linewidth = 0.2) +
  geom_vline(data = tibble(chrom = "chr1", position = 241506090)%>% mutate(chrom = factor(chrom, levels = c(paste0("chr", 1:22), "chrX", "chrY"))), mapping = aes(xintercept = position), color = "red", linewidth = 0.5) +
  theme_few() +
  theme(axis.text = element_text(size = 5),
        axis.text.x.bottom = element_text(angle = 30, vjust = 1, hjust = 1),
        axis.ticks = element_line(linewidth = 0.2),
        axis.ticks.length = unit(0.5, "mm"),
        panel.spacing = unit(1, "mm")) +
  facet_wrap(~ chrom, scales = "free")
pdf(glue("{out_dir}/figS4.pdf"), width = 7, height = 7)
print(a)
d <- dev.off()
a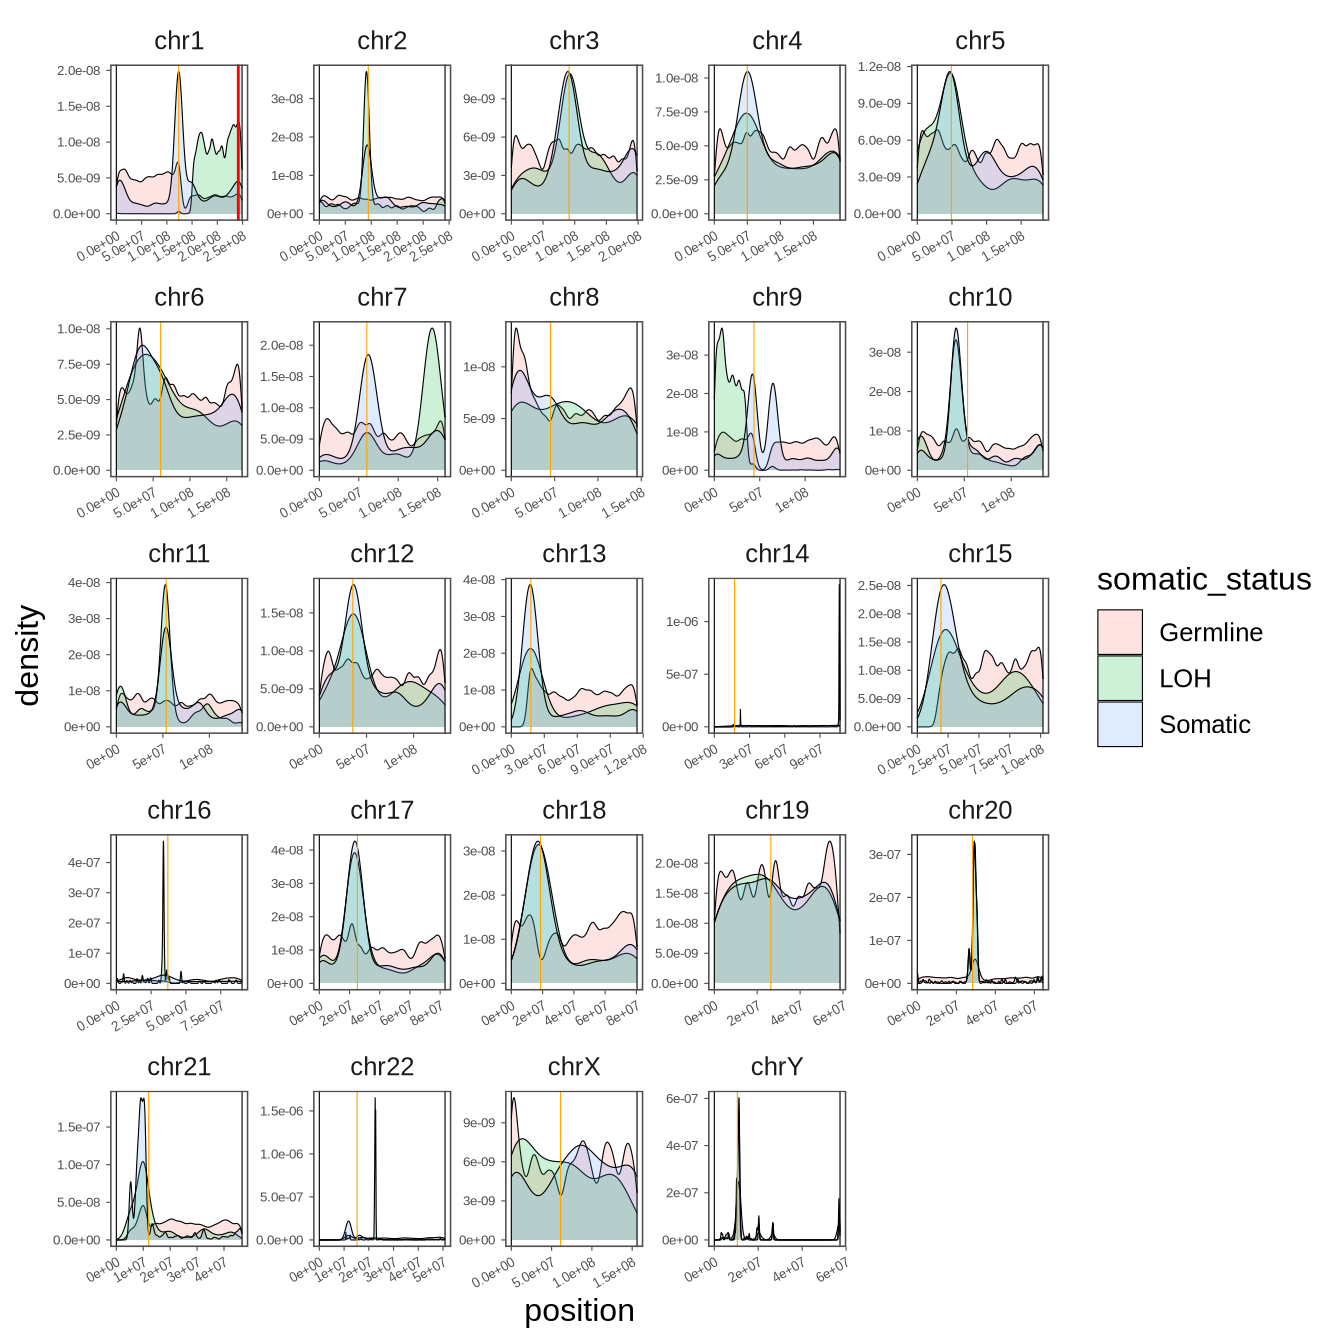
sup_figure5
a <- agsuzhou_zhanglin_BL125.snp  %>%
  ggplot() +
  scattermore::geom_scattermore(mapping = aes(x = position, y = deltavaf,color = somatic_status)) +
  facet_wrap(~chrom, scales = "free_x") +
  geom_vline(data =
               tibble(
                 chrom = c(paste0("chr", 1:22), "chrX", "chrY"),
                 position = c(123435318, 94362040, 91169345, 49892850, 49156541, 60172198, 60186171, 45255268, 43695248, 53488381, 53576500, 35470568, 17755192, 17247124, 19160798, 37007677, 25205468, 18665981, 26346405, 28342188, 12035514, 15283703, 61077972, 10489856)
               ) %>% mutate(chrom = factor(chrom, levels = c(paste0("chr", 1:22), "chrX", "chrY"))), mapping = aes(xintercept = position), color = "orange") +
  geom_vline(data =
               tibble(
                 chrom = c(paste0("chr", 1:22), "chrX", "chrY"),
                 position = c(999, 999, 999, 999, 999, 999, 999, 999, 999, 999, 999, 999, 999, 999, 999, 999, 999, 999, 999, 999, 999, 999, 999, 999)
               ) %>% mutate(chrom = factor(chrom, levels = c(paste0("chr", 1:22), "chrX", "chrY"))),mapping = aes(xintercept = position), color = "black") +
  geom_vline(data =
               tibble(
                 chrom = c(paste0("chr", 1:22), "chrX", "chrY"),
                 position = c(248955422, 242192529, 198294559, 190213555, 181537259, 170804979, 159344973, 145137636, 138393717, 133796422, 135085622, 133274309, 114363328, 107042718, 101990189, 90337345, 83256441, 80372285, 58616616, 64443167, 46708983, 50817468, 156039895, 57226415)) %>% mutate(chrom = factor(chrom, levels = c(paste0("chr", 1:22), "chrX", "chrY"))),
             mapping = aes(xintercept = position), color = "black") +
  geom_vline(data = tibble(chrom = "chr1", position = 241506090) %>% mutate(chrom = factor(chrom, levels = c(paste0("chr", 1:22), "chrX", "chrY"))),
             mapping = aes(xintercept = position), color = "red", alpha = 0.2) +
  theme_few() +
  theme(axis.text = element_text(size = 5),
        axis.text.x.bottom = element_text(angle = 30, vjust = 1, hjust = 1),
        axis.ticks = element_line(linewidth = 0.2),
        axis.ticks.length = unit(0.5, "mm"),
        panel.spacing = unit(1, "mm"))
pdf(glue("{out_dir}/figS5.pdf"), width = 7, height = 7)
print(a)
d <- dev.off()
a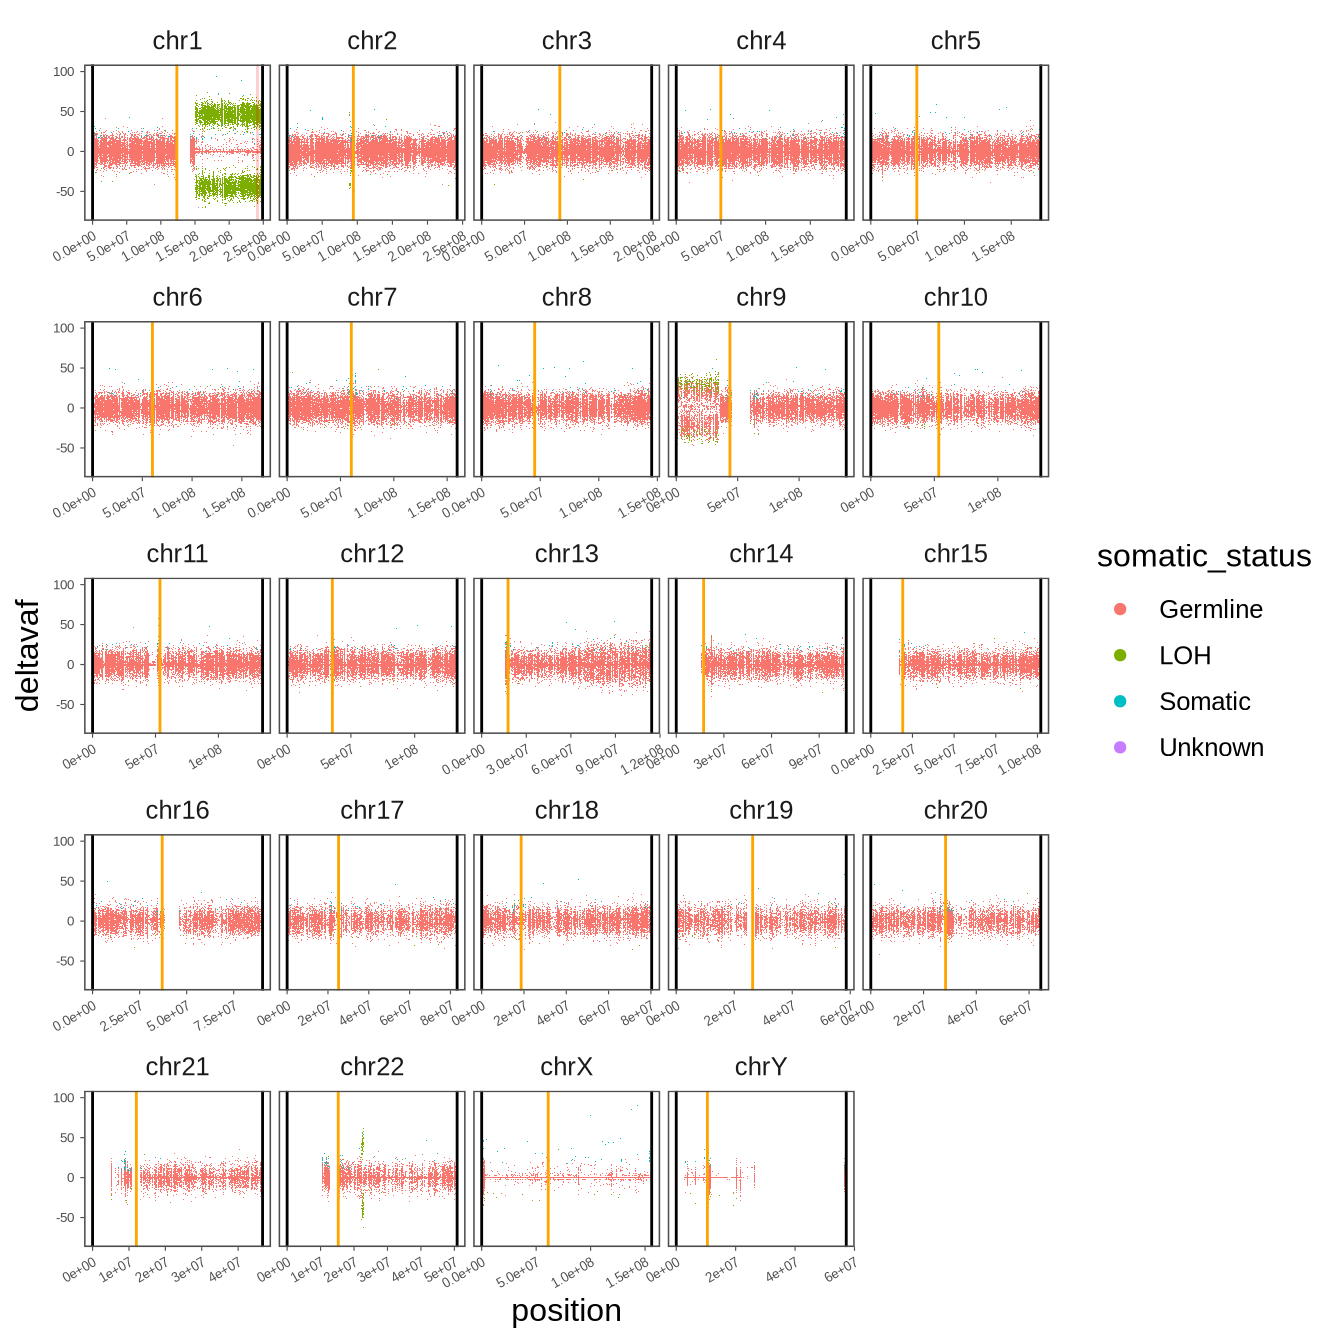
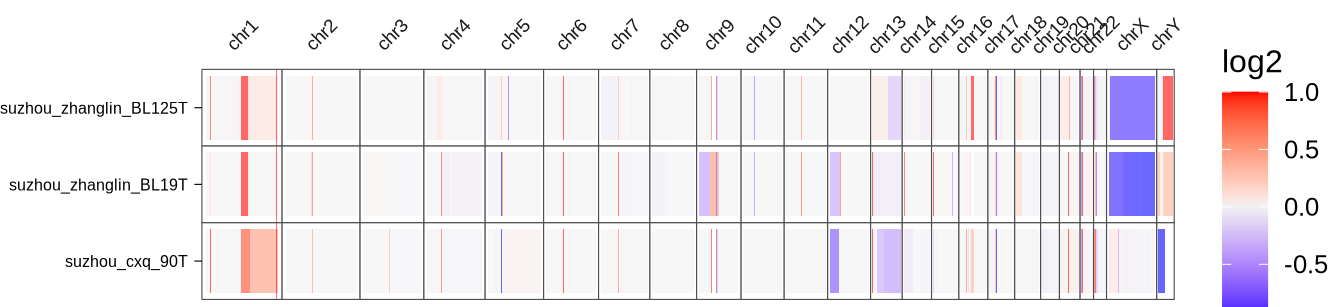
sup_figure6
cnvplotdf <- glue("{in_dir}/cnvkit.rds") %>% read_rds
pdf(glue("{out_dir}/figS6.pdf"), width=7, height=1.6)
a <- ggplot(cnvplotdf,
       aes(x = sample_id, y = midpoint, height = bin_length, fill = log2)) +
  geom_tile(alpha = 0.6)  +
  geom_hline(data = tibble(y = 241506090, chromosome = "chr1")%>%
               dplyr::mutate(
                 chromosome = factor(chromosome, level = c(
                   paste0("chr", 1:22), "chrX", "chrY"
                 ))), mapping = aes(yintercept = y), color  = "red", size  =0.1) +
  scale_fill_gradient2(low = "blue", mid = "grey95", high = "red") +
  theme_bmbdc(font_size = 16, fill = "white", del = "x") +
  facet_grid(sample_id ~ chromosome, scales = "free", space = "free") +
  coord_flip(clip = "off") +
  theme(strip.text.y.right = element_blank(),
        strip.text.x.top = element_text(angle = 45, size = 7),
        strip.background = element_rect(fill = NA),
        strip.clip = "off",
        panel.border = element_rect(size = 0.2),
        axis.title.y = element_blank(),
        axis.ticks = element_line(linewidth = 0.2,color = "black"),
        axis.ticks.length = unit(1, "mm"),
        axis.text = element_text(color = "black"),
        axis.text.y = element_text(size = 6),
        panel.spacing = unit(0, "lines"))
print(a)
d <- dev.off()
a