pkgs <- c("fs", "futile.logger", "configr", "stringr", "ggpubr", "ggthemes",
          "SingleCellExperiment", "BiocNeighbors", "vroom", "jhtools", "glue",
          "openxlsx", "ggsci", "patchwork", "cowplot", "tidyverse", "dplyr",
          "survminer", "survival")
for (pkg in pkgs){
  suppressPackageStartupMessages(library(pkg, character.only = T))
}
res_dir <- "./results/sup_figure8" %>% checkdir
dat_dir <- "./data" %>% checkdir
config_dir <- "./config" %>% checkdir

#colors config
config_fn <- glue::glue("{config_dir}/configs.yaml")
stype3_cols <- jhtools::show_me_the_colors(config_fn, "stype3")
ctype10_cols <- jhtools::show_me_the_colors(config_fn, "cell_type_new")
meta_cols <- jhtools::show_me_the_colors(config_fn, "meta_color")

#read in coldata
coldat <- readr::read_csv(glue::glue("{dat_dir}/sce_coldata.csv"))
sinfo <- readr::read_csv(glue::glue("{dat_dir}/metadata_sinfo.csv"))
sample_chemo_type_list <- readr::read_rds(glue::glue("{dat_dir}/sample_chemo_type_list.rds"))
metadata <- readr::read_rds(glue::glue("{dat_dir}/metadata.rds"))
meta_clu <- readxl::read_excel(glue::glue("{dat_dir}/meta_clu.xlsx")) %>% dplyr::select(-9)

grid.draw.ggsurvplot <- function(x){
  survminer:::print.ggsurvplot(x, newpage = FALSE)
}sup_figure8
sup_figure8ab
sample_to_tiff <- distinct(coldat[, c("stype2", "patient_id", "sample_id", "sample_tiff_id")])
meta_os <- as.data.frame(metadata[["os_analysis"]])
meta_pfs <- as.data.frame(metadata[["pfs_analysis"]])
# community interaction weight
df_inter_weighted <- metadata[["community_interaction_weighted"]]
# allsurgery samples
df_inter_weighted_new_allsurgery <- left_join(df_inter_weighted, sample_to_tiff, by = "sample_tiff_id") %>%
dplyr::filter(sample_id %in% c(sample_chemo_type_list[["chemo"]], sample_chemo_type_list[["no_chemo_no_punc"]]))
df_inter_weighted_new_allsurgery <- df_inter_weighted_new_allsurgery %>%
dplyr::mutate(interact_meta_bi = case_when(from_meta > to_meta ~ str_c(from_meta, "_", to_meta),
TRUE ~ str_c(to_meta, "_", from_meta)))
meta_nochemo_df <- df_inter_weighted_new_allsurgery %>%
group_by(interact_meta_bi, sample_id, patient_id) %>%
dplyr::summarise(mean_weight = mean(weight)) %>% ungroup()
metas <- names(table((meta_nochemo_df$interact_meta_bi)))[table((meta_nochemo_df$interact_meta_bi)) > 1]
meta_nochemo_col <- meta_nochemo_df %>%
dplyr::filter(interact_meta_bi %in% metas) %>%
pivot_wider(id_cols = c("sample_id", "patient_id"),
names_from = interact_meta_bi,
values_from = mean_weight, values_fill = 1)
# MC-tumor-frontline_MC-stroma-macro_vs_MC-tumor-frontline_MC-immune-enriched
os_df <- meta_nochemo_col %>% dplyr::select(sample_id, patient_id,
`MC-tumor-frontline_MC-stroma-macro`,
`MC-tumor-frontline_MC-immune-enriched`) %>%
dplyr::mutate(weight_ratio = `MC-tumor-frontline_MC-stroma-macro`/`MC-tumor-frontline_MC-immune-enriched`) %>%
left_join(sinfo, by = c("sample_id", "patient_id")) %>%
dplyr::mutate(group_median = case_when(weight_ratio >= median(weight_ratio) ~ "high",
weight_ratio < median(weight_ratio) ~ "low"))
os_tmp <- os_df %>% dplyr::select(all_of(c("sample_id", "os_state", "os_month", "group_median"))) %>% drop_na(os_month)
#os
psurv1 <- ggsurvplot(surv_fit(Surv(os_month, os_state) ~ group_median, data = os_tmp),
palette = c("high"="#BC3C29FF", "low"="#0072B5FF"),
legend.labs = levels(droplevels(as.factor(unlist(os_tmp[, "group_median"])))),
pval=T, risk.table = T)#, xlim = c(0,75))
ggsave(glue::glue("{res_dir}/sup_figure8a_os.pdf"),
plot = psurv1, width = 5, height = 5)
pfs_tmp <- os_df %>% dplyr::select(all_of(c("sample_id", "pfs_state", "pfs_month", "group_median"))) %>% drop_na(pfs_month)
#pfs
psurv2 <- ggsurvplot(surv_fit(Surv(pfs_month, pfs_state) ~ group_median, data = pfs_tmp),
palette = c("high"="#BC3C29FF", "low"="#0072B5FF"),
legend.labs = levels(droplevels(as.factor(unlist(pfs_tmp[, "group_median"])))),
pval=T, risk.table = T)#, xlim = c(0,75))
ggsave(glue::glue("{res_dir}/sup_figure8a_pfs.pdf"),
plot = psurv2, width = 5, height = 5)
# MC-tumor-frontline_MC-stroma-mCAF_vs_MC-tumor-frontline_MC-immune-enriched
os_df <- meta_nochemo_col %>% dplyr::select(sample_id, patient_id,
`MC-tumor-frontline_MC-stroma-mCAF`,
`MC-tumor-frontline_MC-immune-enriched`) %>%
dplyr::mutate(weight_ratio = `MC-tumor-frontline_MC-stroma-mCAF`/`MC-tumor-frontline_MC-immune-enriched`) %>%
left_join(sinfo, by = c("sample_id", "patient_id")) %>%
dplyr::mutate(group_median = case_when(weight_ratio >= median(weight_ratio) ~ "high",
weight_ratio < median(weight_ratio) ~ "low"))
os_tmp <- os_df %>% dplyr::select(all_of(c("sample_id", "os_state", "os_month", "group_median"))) %>% drop_na(os_month)
#os
psurv3 <- ggsurvplot(surv_fit(Surv(os_month, os_state) ~ group_median, data = os_tmp),
palette = c("high"="#BC3C29FF", "low"="#0072B5FF"),
legend.labs = levels(droplevels(as.factor(unlist(os_tmp[, "group_median"])))),
pval=T, risk.table = T)#, xlim = c(0,75))
ggsave(glue::glue("{res_dir}/sup_figure8b_os.pdf"),
plot = psurv3, width = 5, height = 5)
pfs_tmp <- os_df %>% dplyr::select(all_of(c("sample_id", "pfs_state", "pfs_month", "group_median"))) %>% drop_na(pfs_month)
#pfs
psurv4 <- ggsurvplot(surv_fit(Surv(pfs_month, pfs_state) ~ group_median, data = pfs_tmp),
palette = c("high"="#BC3C29FF", "low"="#0072B5FF"),
legend.labs = levels(droplevels(as.factor(unlist(pfs_tmp[, "group_median"])))),
pval=T, risk.table = T)#, xlim = c(0,75))
ggsave(glue::glue("{res_dir}/sup_figure8b_pfs.pdf"),
plot = psurv4, width = 5, height = 5)
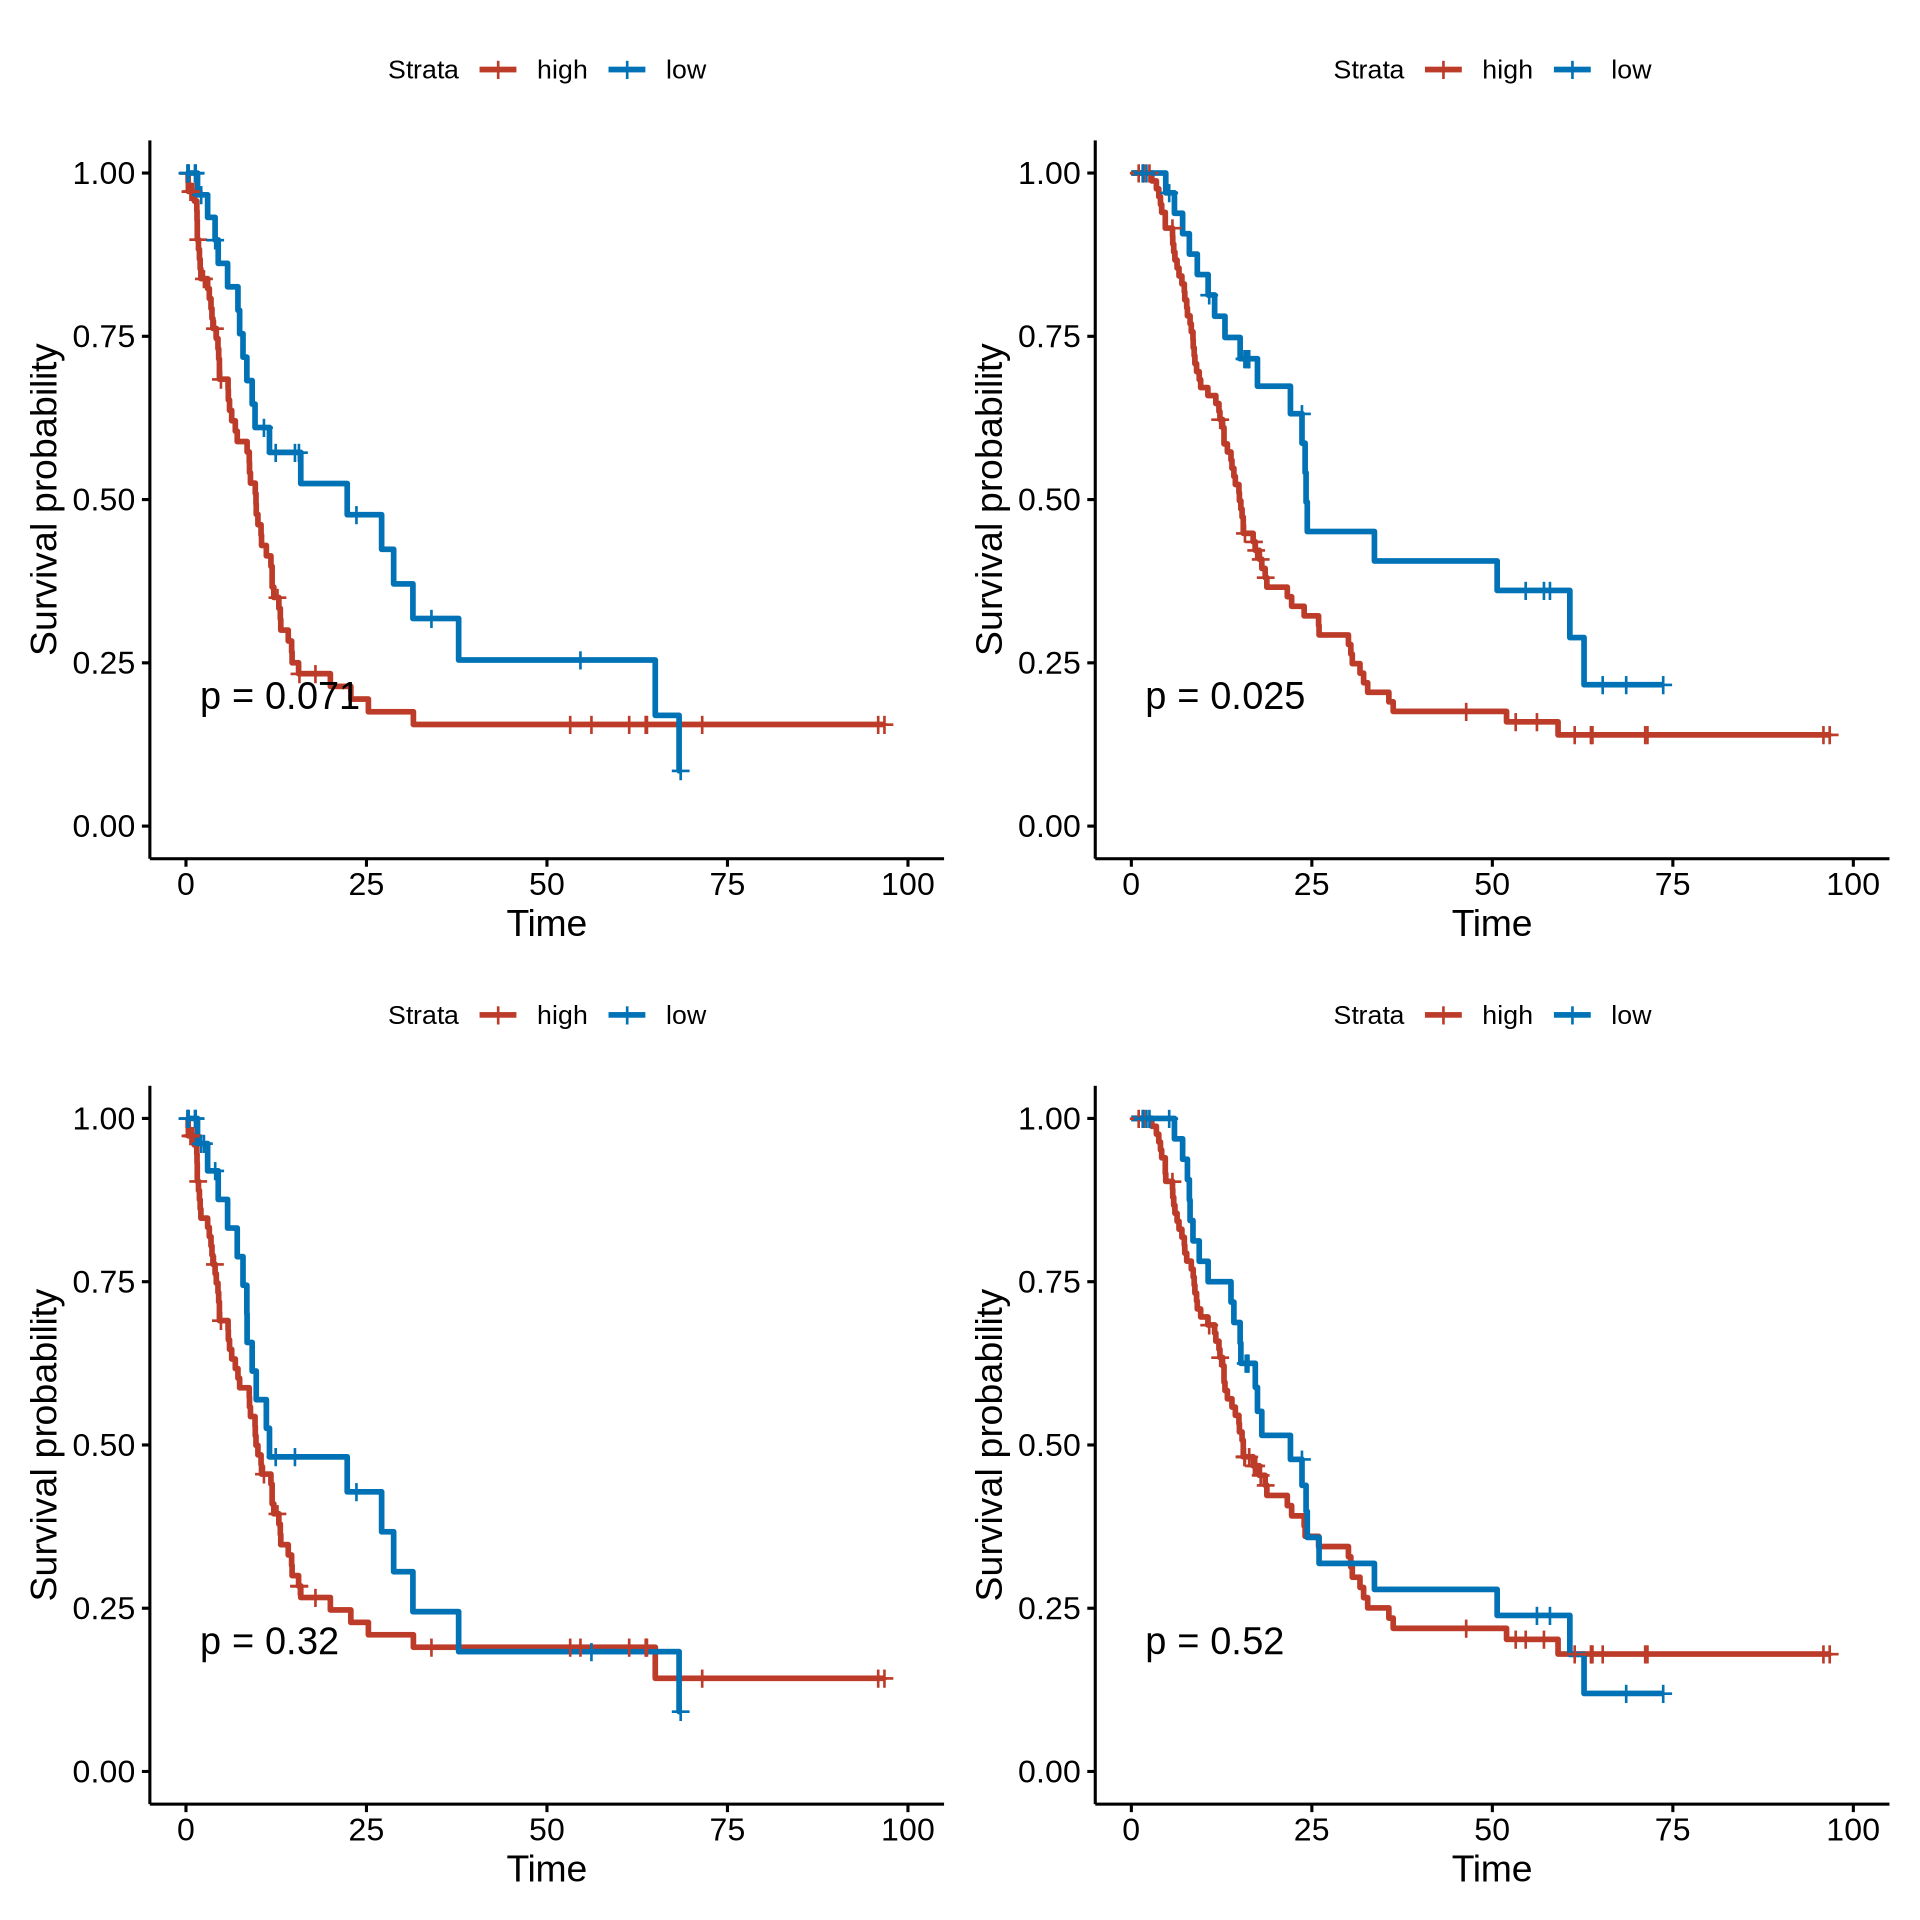
(psurv2$plot | psurv1$plot) / (psurv4$plot | psurv3$plot)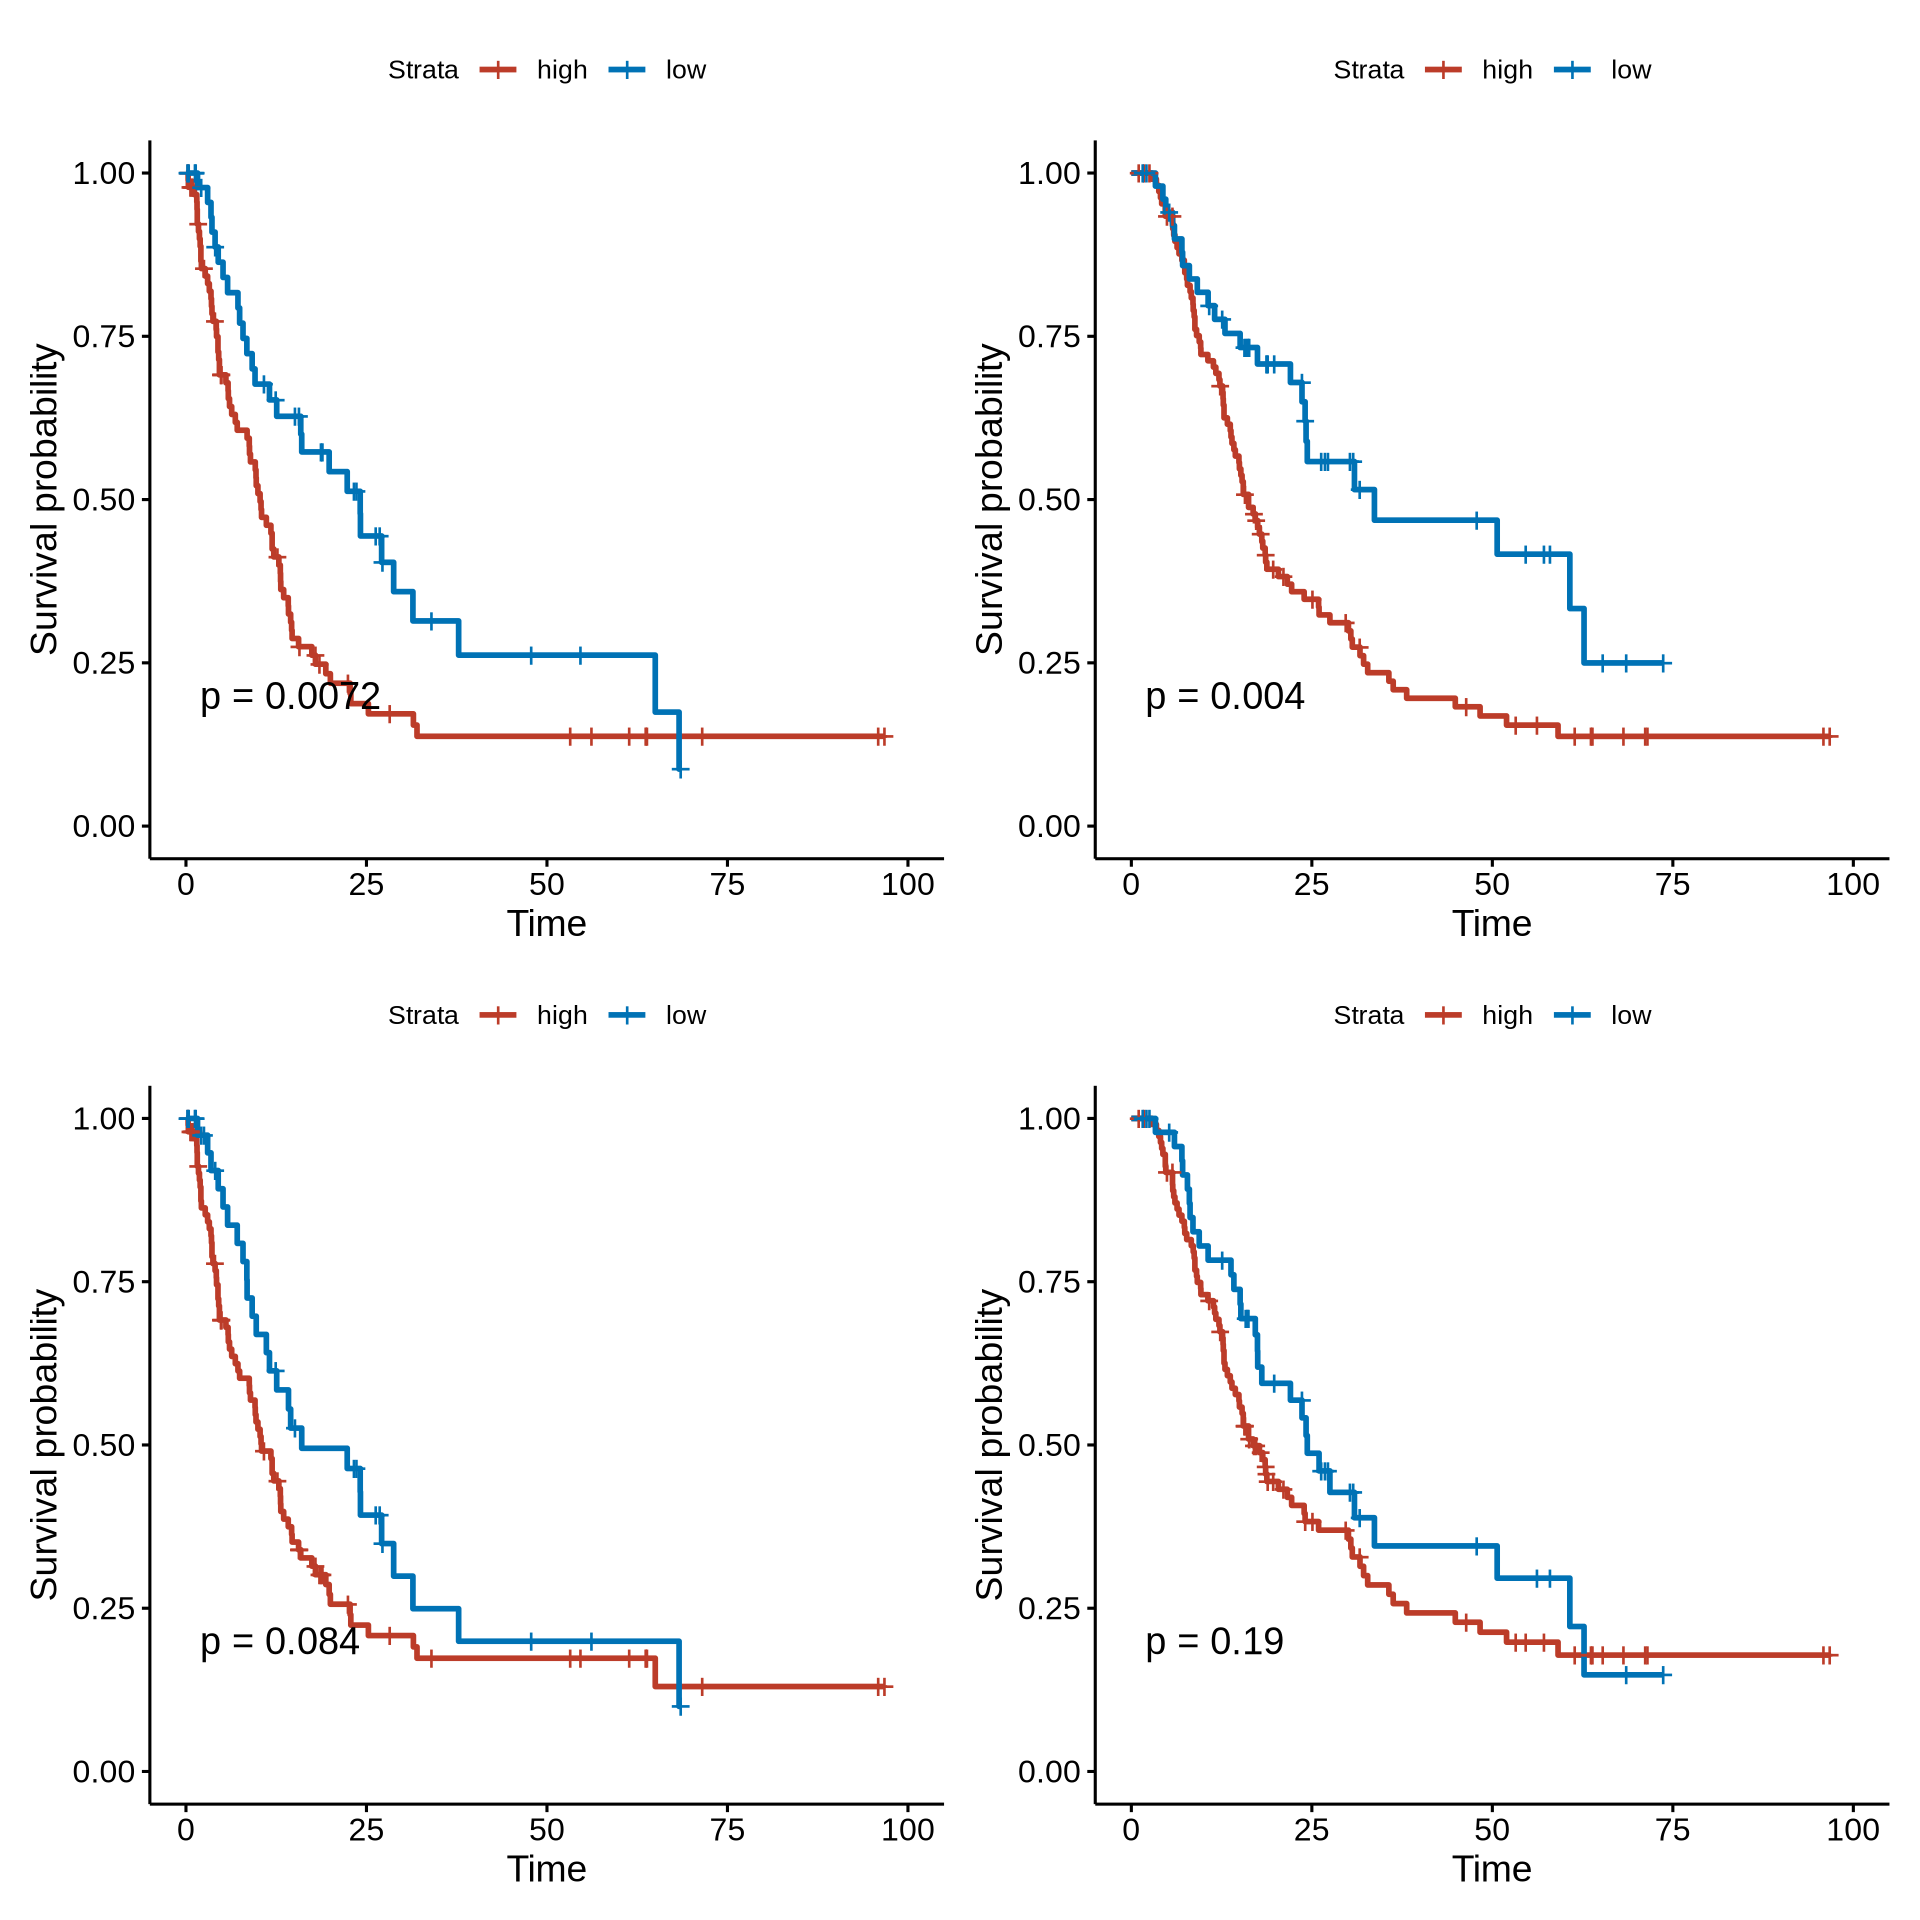
sup_figure8cd
# no_chemo_no_punc
df_inter_weighted_new_nochemo <- left_join(df_inter_weighted, sample_to_tiff, by = "sample_tiff_id") %>%
  dplyr::filter(sample_id %in% sample_chemo_type_list[["no_chemo_no_punc"]])

df_inter_weighted_new_nochemo <- df_inter_weighted_new_nochemo %>%
  dplyr::mutate(interact_meta_bi = case_when(from_meta > to_meta ~ str_c(from_meta, "_", to_meta),
                                             TRUE ~ str_c(to_meta, "_", from_meta)))

meta_nochemo_df <- df_inter_weighted_new_nochemo %>%
  group_by(interact_meta_bi, sample_id, patient_id) %>%
  dplyr::summarise(mean_weight = mean(weight)) %>% ungroup()

metas <- names(table((meta_nochemo_df$interact_meta_bi)))[table((meta_nochemo_df$interact_meta_bi)) > 1]

meta_nochemo_col <- meta_nochemo_df %>%
  dplyr::filter(interact_meta_bi %in% metas) %>%
  pivot_wider(id_cols = c("sample_id", "patient_id"),
              names_from = interact_meta_bi,
              values_from = mean_weight, values_fill = 1)

# MC-tumor-frontline_MC-stroma-macro_vs_MC-tumor-frontline_MC-immune-enriched
 os_df <- meta_nochemo_col %>% dplyr::select(sample_id, patient_id,
                                              `MC-tumor-frontline_MC-stroma-macro`,
                                              `MC-tumor-frontline_MC-immune-enriched`) %>%
      dplyr::mutate(weight_ratio = `MC-tumor-frontline_MC-stroma-macro`/`MC-tumor-frontline_MC-immune-enriched`) %>%
      left_join(sinfo, by = c("sample_id", "patient_id")) %>%
      dplyr::mutate(group_median = case_when(weight_ratio >= median(weight_ratio) ~ "high",
                                             weight_ratio < median(weight_ratio) ~ "low"))

os_tmp <- os_df %>% dplyr::select(all_of(c("sample_id", "os_state", "os_month", "group_median"))) %>% drop_na(os_month)
#os
psurv1 <- ggsurvplot(surv_fit(Surv(os_month, os_state) ~ group_median, data = os_tmp),
                           palette = c("high"="#BC3C29FF", "low"="#0072B5FF"),
                           legend.labs = levels(droplevels(as.factor(unlist(os_tmp[, "group_median"])))),
                           pval=T, risk.table = T)#, xlim = c(0,75))
ggsave(glue::glue("{res_dir}/sup_figure8c_os.pdf"),
             plot = psurv1, width = 5, height = 5)


pfs_tmp <- os_df %>% dplyr::select(all_of(c("sample_id", "pfs_state", "pfs_month", "group_median"))) %>% drop_na(pfs_month)
#pfs
psurv2 <- ggsurvplot(surv_fit(Surv(pfs_month, pfs_state) ~ group_median, data = pfs_tmp),
                           palette = c("high"="#BC3C29FF", "low"="#0072B5FF"),
                           legend.labs = levels(droplevels(as.factor(unlist(pfs_tmp[, "group_median"])))),
                           pval=T, risk.table = T)#, xlim = c(0,75))
ggsave(glue::glue("{res_dir}/sup_figure8c_pfs.pdf"),
             plot = psurv2, width = 5, height = 5)


# MC-tumor-frontline_MC-stroma-mCAF_vs_MC-tumor-frontline_MC-immune-enriched
 os_df <- meta_nochemo_col %>% dplyr::select(sample_id, patient_id,
                                              `MC-tumor-frontline_MC-stroma-mCAF`,
                                              `MC-tumor-frontline_MC-immune-enriched`) %>%
      dplyr::mutate(weight_ratio = `MC-tumor-frontline_MC-stroma-mCAF`/`MC-tumor-frontline_MC-immune-enriched`) %>%
      left_join(sinfo, by = c("sample_id", "patient_id")) %>%
      dplyr::mutate(group_median = case_when(weight_ratio >= median(weight_ratio) ~ "high",
                                             weight_ratio < median(weight_ratio) ~ "low"))

os_tmp <- os_df %>% dplyr::select(all_of(c("sample_id", "os_state", "os_month", "group_median"))) %>% drop_na(os_month)
#os
psurv3 <- ggsurvplot(surv_fit(Surv(os_month, os_state) ~ group_median, data = os_tmp),
                           palette = c("high"="#BC3C29FF", "low"="#0072B5FF"),
                           legend.labs = levels(droplevels(as.factor(unlist(os_tmp[, "group_median"])))),
                           pval=T, risk.table = T)#, xlim = c(0,75))
ggsave(glue::glue("{res_dir}/sup_figure8d_os.pdf"),
             plot = psurv3, width = 5, height = 5)


pfs_tmp <- os_df %>% dplyr::select(all_of(c("sample_id", "pfs_state", "pfs_month", "group_median"))) %>% drop_na(pfs_month)
#pfs
psurv4 <- ggsurvplot(surv_fit(Surv(pfs_month, pfs_state) ~ group_median, data = pfs_tmp),
                           palette = c("high"="#BC3C29FF", "low"="#0072B5FF"),
                           legend.labs = levels(droplevels(as.factor(unlist(pfs_tmp[, "group_median"])))),
                           pval=T, risk.table = T)#, xlim = c(0,75))
ggsave(glue::glue("{res_dir}/sup_figure8d_pfs.pdf"),
             plot = psurv4, width = 5, height = 5)

(psurv2$plot | psurv1$plot) / (psurv4$plot | psurv3$plot)