pkgs <- c("fs", "futile.logger", "configr", "stringr", "ggpubr", "ggthemes", "SingleCellExperiment",
          "RColorBrewer", "vroom", "jhtools", "glue", "jhuanglabHyperion", "openxlsx", "ggsci", "ggraph",
          "patchwork", "cowplot", "tidyverse", "dplyr", "rstatix", "magrittr", "igraph","tidygraph")
for (pkg in pkgs){
  suppressPackageStartupMessages(library(pkg, character.only = T))
}
res_dir <- "./results/figure3" %>% checkdir
dat_dir <- "./data" %>% checkdir
config_dir <- "./config" %>% checkdir

#colors config
config_fn <- glue::glue("{config_dir}/configs.yaml")
stype3_cols <- jhtools::show_me_the_colors(config_fn, "stype3")
ctype10_cols <- jhtools::show_me_the_colors(config_fn, "cell_type_new")
meta_cols <- jhtools::show_me_the_colors(config_fn, "meta_color")

#read in coldata
coldat <- readr::read_csv(glue::glue("{dat_dir}/sce_coldata.csv"))
meta_clu <- readxl::read_excel(glue::glue("{dat_dir}/meta_clu.xlsx")) %>% dplyr::select(-9)
ci <- readr::read_rds(glue::glue("{dat_dir}/ci_list.rds"))
sample_chemo_type_list <- readr::read_rds(glue::glue("{dat_dir}/sample_chemo_type_list.rds"))
metadata <- readr::read_rds(glue::glue("{dat_dir}/metadata.rds"))

# function
interaction_plot <- function(x, conditionCol, group, colors, threshold = 0.1, selfDe = T){
    from <- "from_meta"
    to <- "to_meta"
    fn <- "metacluster_"
    cols <- colors

  if (selfDe == TRUE) {
    fil <- "filteredself"
    dt_cl <- x %>% dplyr::filter(.data[[from]] != .data[[to]]) %>% group_by(.data[[from]], .data[[to]], .data[[conditionCol]]) %>% summarise(N = n()) %>%
      left_join(x %>% dplyr::filter(.data[[from]] != .data[[to]]) %>% group_by(.data[[conditionCol]]) %>% summarise(NT = n()), by = conditionCol) %>% dplyr::mutate(pct = N/NT * 100)
  } else {
    fil <- ""
    dt_cl <- x %>% group_by(.data[[from]], .data[[to]], .data[[conditionCol]]) %>% summarise(N = n()) %>%
      left_join(x %>% group_by(.data[[conditionCol]]) %>% summarise(NT = n()), by = conditionCol) %>% dplyr::mutate(pct = N/NT * 100)
  }

  dt_cl <- dt_cl %>% group_by(.data[[conditionCol]])
  glist <- dt_cl %>% dplyr::filter(pct > 0.1) %>% group_map(~as_tbl_graph(dplyr::select(.,c(.data[[from]], .data[[to]], pct))))
  gkeys <- dt_cl %>% group_keys()
  plist <- list()
  for(i in 1:length(glist)){
    g <- glist[[i]]
    if(length(g) == 0) next
    names <- paste0(fn, group, "_", gkeys[i,][[conditionCol]], "_", fil)
    plist[[names]] <- ggraph(g, "stress") +
      geom_edge_link(aes(edge_width = pct, alpha = pct)) +
      geom_node_point(aes(color = name), size = 3) +
      #geom_node_text(aes(label = name), size = 4, repel = T, colour = "red") +
      scale_edge_width("interaction percentage", range = c(0.2, 1.5), breaks = c(0.1,1,3,5,10,15,20,25),limits=c(0.1, 25), #oob = scales::squish,
                       guide = guide_legend(title.theme = element_text(size = 8), ncol = 1, byrow = FALSE, keywidth = 0.8, keyheight = 0.1)) +
      scale_edge_alpha("interaction percentage", range = c(0.1, 1.5), breaks = c(0.1,1,3,5,10,15,20,25),limits=c(0.1, 25), oob = scales::squish) +
      scale_color_manual(limits = as.factor(V(g)$name), values = cols) +
      theme_graph(base_family = 'Helvetica', base_size =8) +
      guides(col = guide_legend(title = "interaction", ncol = 1, byrow = FALSE, keywidth = 0.1, keyheight = 0.1,
                                override.aes = list(size=1),title.theme = element_text(size = 8)))
  }
  return(plist)
}figure3
figure3a
levels(metadata[["differentiation_degree"]]$diff_degree) = c("low", "middle", "high")
levels(metadata[["stages_tme"]]$stage) = c("MPC", "BRPC_LAPC", "RPC")

keycols_list <- c(list("stage"), list("treatment_type"), list("os_group_24"))
compare_groups <- c("stages_tme", "neoadj_vs_direct_surgery", "os_analysis")
names(keycols_list) <- compare_groups

meta_cluster_names <- rev(c("MC-macro-c2", "MC-macro-c1", "MC-immune-myeloid",
                            "MC-immune-enriched", "MC-stroma-CAF", "MC-stroma-macro",
                            "MC-stroma-mCAF", "MC-tumor-frontline", "MC-tumor-core"))

total_group <- coldat %>%
  dplyr::select(c(sample_id, sample_tiff_id, patient_id, cell_id,
                  stype2, cluster_names, meta_cluster)) %>%
  na.omit() %>% dplyr::filter(meta_cluster %in% meta_cluster_names)

plist <- list()

total_group_pro <- total_group %>% group_by(meta_cluster, sample_tiff_id) %>%
  summarise(pro = n()/nrow(total_group)) %>% group_by(meta_cluster) %>% dplyr::mutate(pro_total = sum(pro))

total_group_pro$meta_cluster <- fct_relevel(total_group_pro$meta_cluster, meta_cluster_names)
p1 <- ggplot(distinct(total_group_pro[,c("meta_cluster", "pro_total")]),
             aes(x = pro_total, y = meta_cluster, fill = meta_cluster)) +
  geom_bar(stat='identity', linewidth = 0.8) +
  theme_classic() +
  scale_fill_manual(values = meta_cols,
                    labels = vars(meta_cluster)) +
  theme(strip.placement  = "outside",
        panel.spacing    = unit(3, "points"),
        strip.background = element_blank(),
        strip.text       = element_text(face = "bold", size = 5),
        axis.text.x = element_text(size = 10, colour="black"),
        axis.text.y = element_text(size = 10, colour="black"),
        axis.line.x = element_line(linewidth = 0.4),
        axis.line.y = element_line(linewidth = 0.4),
        legend.position="none")
plist[["total"]] <- p1
ggsave(glue::glue("{res_dir}/fig3a_community_total_metacluster.pdf"), p1, width = 3, height = 4)
p1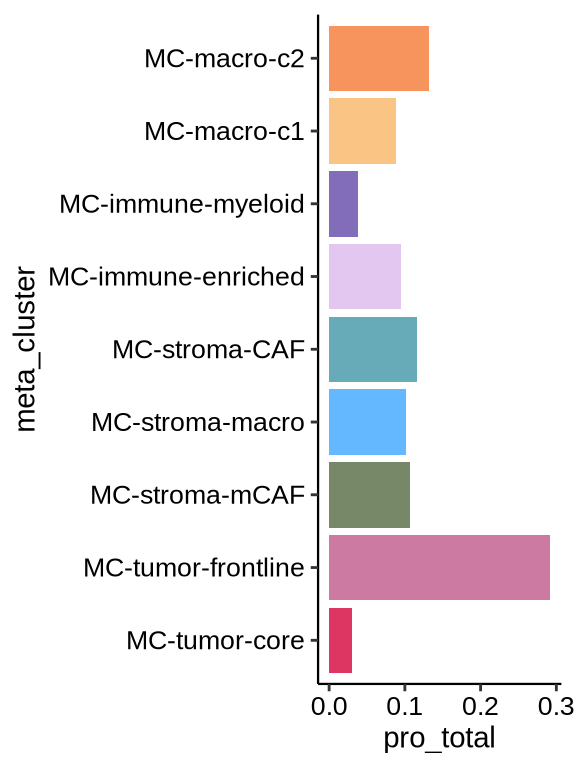
figure3bcd
all_total <- total_group_pro %>% dplyr::select(meta_cluster, pro_total) %>% distinct() %>% ungroup()
factor_list <- list("stages_tme" = c("MPC", "BRPC_LAPC", "RPC"),
                    "neoadj_vs_direct_surgery" = c("direct_surgery", "surgery_after_chemo"),
                    "os_analysis" = c("short", "long"))

for(compare_group in compare_groups){
  #cli::cli_h1(compare_group)
  groups <- metadata[[compare_group]]
  gp_key <- keycols_list[[compare_group]]
  cli::cli_alert_info(gp_key)
  groups <- groups %>% drop_na(all_of(gp_key))

  dt_groups <- total_group %>% dplyr::filter(patient_id %in% groups$patient_id)
  if (compare_group == "chemo_outcome_before") {
    dt_groups <- dt_groups %>% dplyr::filter(stype2 %in% c("before_chemo","puncture_pdac"))
  } else {
    dt_groups <- dt_groups %>% dplyr::filter(stype2 %in% c("after_chemo","tumor"))
  }
  dat_plot <- dt_groups %>%
    group_by(meta_cluster, sample_tiff_id) %>%
    summarise(nc = n()) %>%
    group_by(sample_tiff_id) %>%
    dplyr::mutate(nt = sum(nc)) %>%
    dplyr::mutate(pro = nc/nt) %>% ungroup()
  dat_plot$meta_cluster <- factor(dat_plot$meta_cluster, levels = meta_cluster_names)

  metainfo <- coldat[, c("sample_tiff_id", "patient_id")] %>% distinct()
  dat_plot <- inner_join(dat_plot, metainfo, by = "sample_tiff_id") %>%
    inner_join(groups, by = "patient_id") %>% distinct()

  dat_plot[[gp_key]] <- factor(dat_plot[[gp_key]], levels = factor_list[[compare_group]])
  dat_plot$meta_cluster <- fct_relevel(dat_plot$meta_cluster, meta_cluster_names)
  p <- ggboxplot(dat_plot, x = "meta_cluster", y = "pro", fill = gp_key, outlier.shape = NA,
                 palette = pal_nejm("default")(3), xlab = NULL,size = 0.2) + theme_classic() +
    theme(strip.placement  = "outside",
          panel.spacing    = unit(3, "points"),
          strip.background = element_blank(),
          strip.text       = element_text(face = "bold", size = 5),
          axis.text.x = element_text(size = 10, colour="black"),
          axis.text.y = element_blank(),
          axis.line.x = element_line(size = 0.4),
          axis.line.y = element_line(size = 0.4),
          legend.position="right") +
    labs(x= NULL, y = NULL)
  exp1 <- expr(pro ~ !!ensym(gp_key))
  stat_test <- dat_plot %>%
    group_by(meta_cluster) %>% rstatix::wilcox_test(eval(exp1), p.adjust.method = "BH")
  stat_test <- stat_test %>% mutate(p.adj.signif = case_when(p >= 0.05 ~ "ns",
                                                            p >= 0.01 & p < 0.05 ~ "*",
                                                            p >= 0.001 & p < 0.01 ~ "**",
                                                            p >= 0.0001 & p < 0.001 ~ "***",
                                                            p < 0.0001 ~ "****",
                                                            TRUE ~ "ns"))
  stat_test <- stat_test %>%
    add_xy_position(x = "meta_cluster", dodge = 0.8)
  p1 <- p +
    stat_pvalue_manual(
      stat_test, tip.length = 0.01, hide.ns = T, label = "p.adj.signif",
      coord.flip = TRUE
    ) + coord_flip() +
    guides(fill = guide_legend(reverse = TRUE))
  plist[[compare_group]] <- p1
  #write_rds(p1, glue::glue("{compare_group}_boxplot_wilct_sams.rds"))
}
pc <- (plist[[1]]|plist[[2]]|plist[[3]]|plist[[4]]) + plot_layout(guides = 'collect', widths = c(2, 2.5, 2.5, 2.5))
ggsave(glue::glue("{res_dir}/fig3abcd_wilct.pdf"), pc, width = 10, height = 4)
pc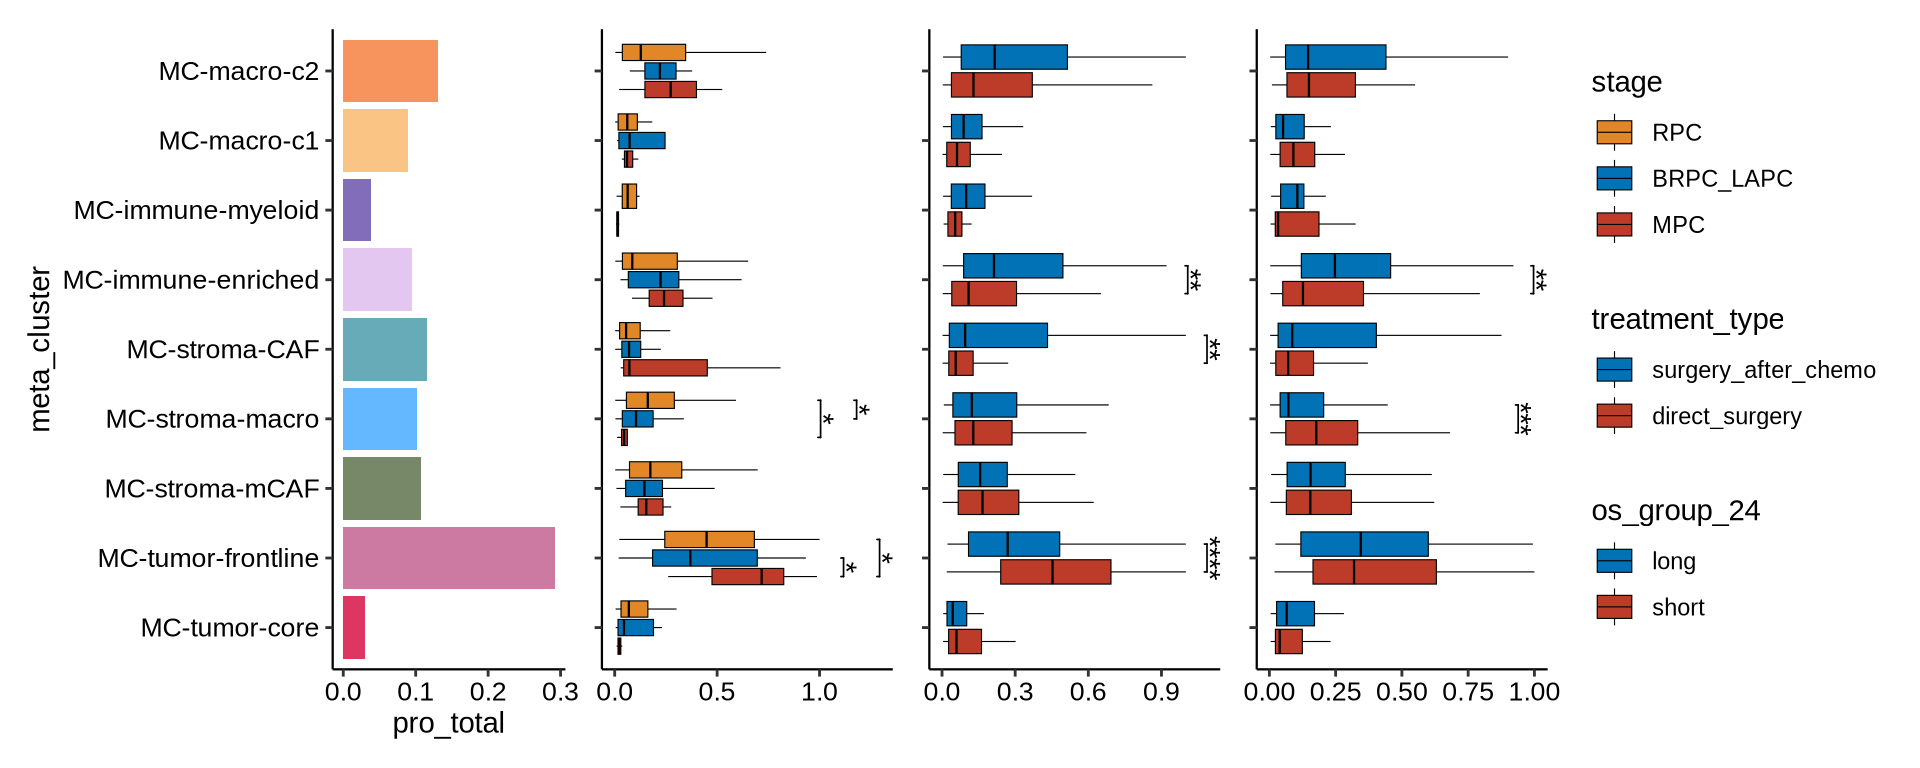
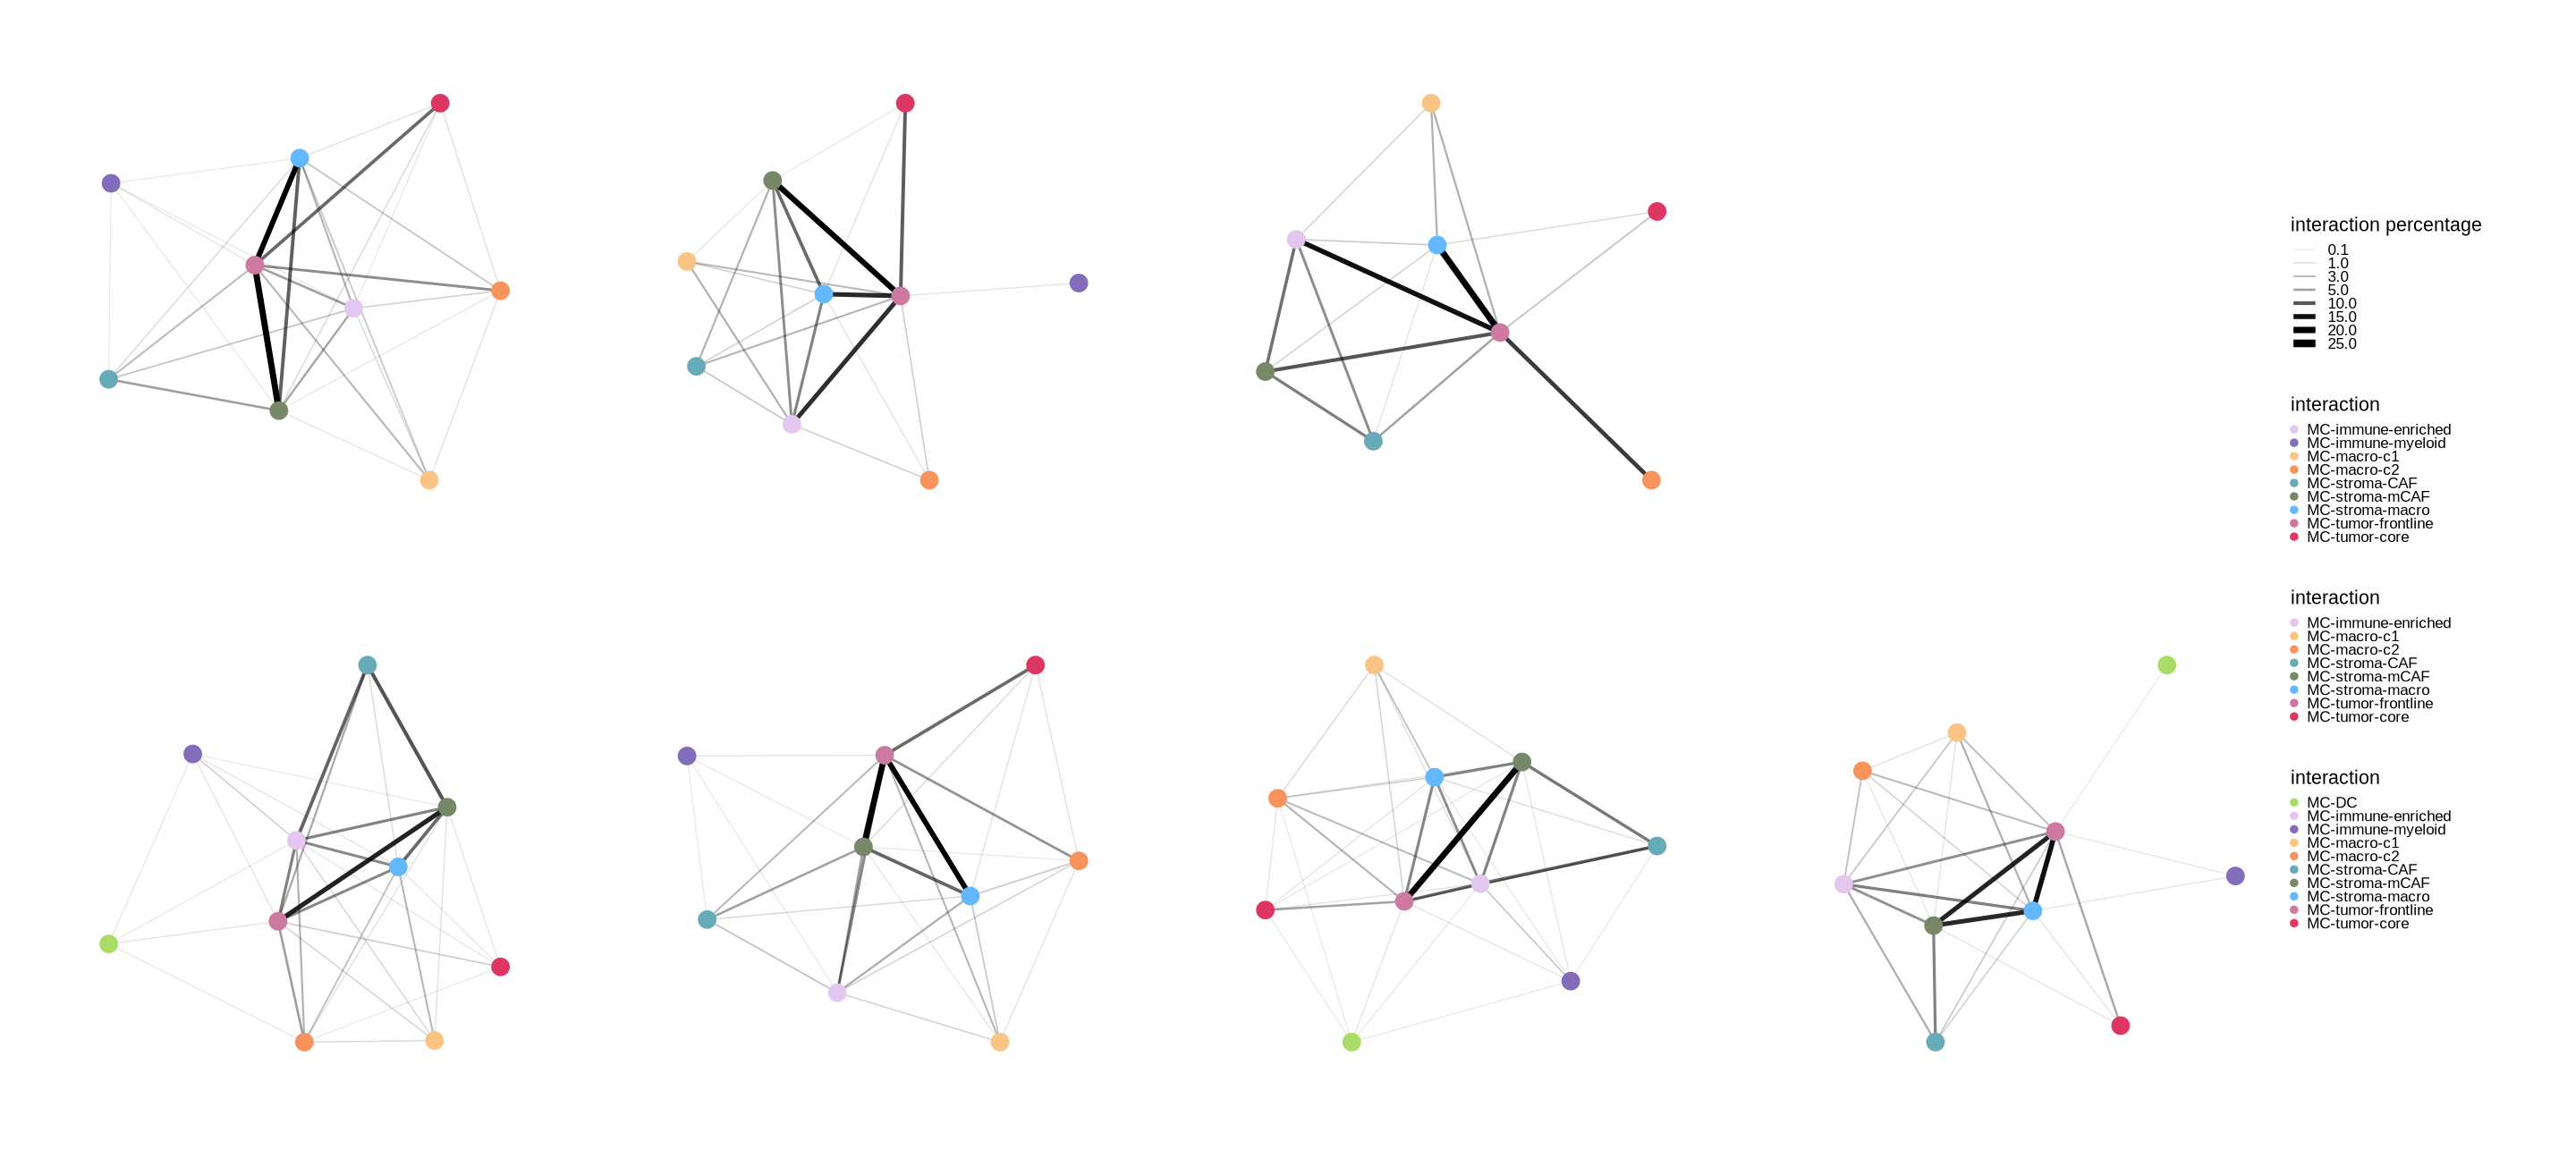
figure3efg
factor_list <- list("stages_tme" = c("RPC", "BRPC_LAPC", "MPC"),
                    "neoadj_vs_direct_surgery" = c("surgery_after_chemo", "direct_surgery"),
                    "os_analysis" = c("long", "short"))

# clinical metadata
keycols_list <- c(list("stage"), list("treatment_type"),
                 list("os_group_24"))

names(keycols_list) <- c("stages_tme", "neoadj_vs_direct_surgery", "os_analysis")

dt_list <- list()
for (i in 1:length(keycols_list)) {
  dt_list[[i]] <- metadata[[names(keycols_list[i])]][c("patient_id", keycols_list[[i]])]
  dt_list[[i]] <- coldat %>% dplyr::filter(patient_id %in% dt_list[[i]]$patient_id) %>%
    dplyr::select(sample_id, stype2, patient_id) %>% unique() %>% left_join(dt_list[[i]], by = "patient_id")

  if (names(keycols_list)[i] == "chemo_outcome_before") {
    dt_list[[i]] <- dt_list[[i]] %>% dplyr::filter(sample_id %in% sample_chemo_type_list[["no_chemo_all"]])
  } else {
    dt_list[[i]] <- dt_list[[i]] %>% dplyr::filter(stype2 %in% c("after_chemo","tumor"))
  }
}

for (i in 1:length(dt_list)) {
  dt_list[[i]] <- left_join(dt_list[[i]] %>% dplyr::select(-patient_id),
                            distinct(coldat[,c("sample_id", "sample_tiff_id")]), by = "sample_id")
  dt_list[[i]] <- left_join(dt_list[[i]], do.call("rbind", ci), by = "sample_tiff_id") %>%
    dplyr::select(-c(from, to))
}

for (i in 1:length(dt_list)) {
  dt_list[[i]] <- dt_list[[i]] %>% left_join(meta_clu[, c("old_cluster_name", "meta_short_new")],
                                             by = c("from_cluster" = "old_cluster_name")) %>%
    dplyr::rename("from_meta_old" = "from_meta", "from_meta" = "meta_short_new") %>%
    left_join(meta_clu[, c("old_cluster_name", "meta_short_new")],
              by = c("to_cluster" = "old_cluster_name")) %>%
    dplyr::rename("to_meta_old" = "to_meta", "to_meta" = "meta_short_new")

  dt_list[[i]][[keycols_list[[i]]]] <- factor(dt_list[[i]][[keycols_list[[i]]]],
                                              levels = factor_list[[names(keycols_list)[i]]])
}

p_list <- list()
for (i in 1:length(dt_list)) {
  for (j in 1:length(keycols_list[[i]])) {
    group1 <- str_c(names(keycols_list)[i],keycols_list[[i]][j], sep= "_")
    p_list[[group1]] <- interaction_plot(dt_list[[i]] %>%
                                           dplyr::select(sample_id, keycols_list[[i]][j],
                                                         sample_tiff_id, from_cluster,
                                                         to_cluster, from_meta, to_meta) %>%
                                           na.omit(), colors = meta_cols,
                                          conditionCol = keycols_list[[i]][j], group = group1)
  }
}

p_mian <- p_list[[1]][[1]] + p_list[[1]][[2]] + p_list[[1]][[3]] +
  p_list[[2]][[1]] + p_list[[2]][[2]] + p_list[[3]][[1]] + p_list[[3]][[2]] +
  plot_layout(design = "123#\n4567", guides='collect')
ggsave(glue::glue("{res_dir}/fig3efg.pdf"), p_mian, width = 15, height = 6.75)
p_mian