pkgs <- c("fs", "futile.logger", "configr", "stringr", "ggpubr", "ggthemes",
          "vroom", "jhtools", "glue", "openxlsx", "ggsci", "patchwork", "cowplot",
          "tidyverse", "dplyr", "SingleCellExperiment", "imcRtools", "survminer", "survival")
suppressMessages(conflicted::conflict_scout())
for (pkg in pkgs){
  suppressPackageStartupMessages(library(pkg, character.only = T))
}
res_dir <- "./results/figure4" %>% checkdir
dat_dir <- "./data" %>% checkdir
config_dir <- "./config" %>% checkdir

#colors config
config_fn <- glue::glue("{config_dir}/configs.yaml")
ctype10_cols <- jhtools::show_me_the_colors(config_fn, "cell_type_new")
meta_cols <- jhtools::show_me_the_colors(config_fn, "meta_color")
meta_merge_cols <- jhtools::show_me_the_colors(config_fn, "meta_merge")

#read in coldata
coldat <- readr::read_csv(glue::glue("{dat_dir}/sce_coldata.csv"))
sinfo <- readr::read_csv(glue::glue("{dat_dir}/metadata_sinfo.csv"))
sample_chemo_type_list <- readr::read_rds(glue::glue("{dat_dir}/sample_chemo_type_list.rds"))
metadata <- readr::read_rds(glue::glue("{dat_dir}/metadata.rds"))
pos_cells10 <- readr::read_rds(glue::glue("{dat_dir}/pos_cell_list_10percent.rds"))figure4
figure4a
coldat <- coldat %>%
  dplyr::mutate(cell_type11 = case_when(cell_type_new %in%
                                          c("HLA-DR+CD163- mp", "HLA-DR+CD163+ mp", "HLA-DR-CD163+ mp") ~ "Other-mp",
                                        cell_type_new %in% c("HLA-DR-CD163- mp") ~ "DN-mp",
                                        TRUE ~ cell_type_new)) %>%
  dplyr::mutate(meta_merge = case_when(meta_cluster %notin%
                                         c("MC-tumor-frontline", "MC-stroma-macro", "MC-tumor-core") ~ "MC-others",
                                       TRUE ~ meta_cluster))

cell_types <- c("Epithelial tumor cell", "Col1+ CAF", "myoCAF", "HLA-DR-CD163- MMT",
                "HLA-DR+CD163- MMT", "HLA-DR+CD163+ MMT", "HLA-DR-CD163- mp",
                "HLA-DR-CD163+ mp", "HLA-DR+CD163- mp", "HLA-DR+CD163+ mp",
                "Monocyte", "MDSC", "B cell", "CD4+ T cell", "CD8+ T cell",
                "CCR6+ cell", "Vim+ cell", "Ki67+ cell", "B7-H4+ cell", "DC",
                "Normal epithelial cell", "PSC", "Endothelial cell", "Unknown")

out_inter <- readr::read_csv(glue::glue("{dat_dir}/nochemoall_sce_neib_nbhood_dmax4_classic_testInteractions_bymetamerge.csv"))

#format results
out_inter_sig <- out_inter %>% dplyr::filter(from_label != "Unknown" & to_label != "Unknown") %>%
  dplyr::mutate(inter_sig = case_when(sigval < 0 ~ p_gt * sigval,
                                      sigval > 0 ~ p_lt * sigval,
                                      sigval == 0 & p_gt >= p_lt ~ -(1-p_gt),
                                      sigval == 0 & p_gt < p_lt ~ (1-p_lt)),
                logp = -log10(p)) %>%
  dplyr::select(group_by, from_label, to_label, inter_sig, logp)

# pearson correlation of cell type proportions
dt_cell_roi <- coldat %>%
  dplyr::filter(sample_id %in% sample_chemo_type_list$no_chemo_all) %>%
  dplyr::select(cell_type_new, meta_merge, sample_tiff_id) %>%
  dplyr::rename(cell_type = cell_type_new) %>%
  group_by(sample_tiff_id, meta_merge, cell_type) %>%
  dplyr::mutate(n_cell = n()) %>% ungroup() %>%
  distinct() %>% group_by(sample_tiff_id, meta_merge) %>%
  dplyr::mutate(n_total = sum(n_cell)) %>% ungroup() %>%
  dplyr::mutate(prop = n_cell/n_total)
dt_cell_roi$cell_type <- factor(dt_cell_roi$cell_type, levels = cell_types)
dt_cell_roi <- dt_cell_roi %>%
  group_by(meta_merge, sample_tiff_id) %>%
  complete(cell_type, fill = list(prop = 0)) %>% ungroup()

metas <- unique(dt_cell_roi$meta_merge)
dt_cell_roi_ls <- list()
df_cor <- list()
for (i in metas) {
  dt_cell_roi_ls[[i]] <- dt_cell_roi %>%
    dplyr::filter(meta_merge == i) %>%
    dplyr::select(cell_type, sample_tiff_id, prop) %>%
    pivot_wider(names_from = cell_type, values_from = prop, values_fill = 0)
  mat_df <- dt_cell_roi_ls[[i]] %>% as.data.frame() %>% `rownames<-`(.$sample_tiff_id) %>% .[,-1] %>% as.matrix()
  df_cor[[i]] <- cor(mat_df)
}

pl <- list()
for (i in c("MC-tumor-frontline", "MC-stroma-macro", "MC-others")) {
  dt_tb <- as_tibble(df_cor[[i]], rownames = "from_label") %>%
    pivot_longer(!("from_label"), names_to = "to_label", values_to = "cor")

  # plot
  pt_tb <- out_inter_sig %>% dplyr::filter(group_by == i) %>%
    left_join(dt_tb, by = c("from_label","to_label")) %>%
    dplyr::filter(from_label  %notin% c("Endothelial cell", "DC", "B7-H4+ cell") &
                    to_label  %notin% c("Endothelial cell", "DC", "B7-H4+ cell"))

  cell_cur <- cell_types[cell_types %in% unique(pt_tb$from_label)]
  pt_tb$from_label <- factor(pt_tb$from_label, levels = cell_cur)
  pt_tb$to_label <- factor(pt_tb$to_label, levels = cell_cur)

  pl[[i]] <- ggplot(pt_tb, aes(from_label, to_label)) +
    geom_tile(aes(fill = cor)) +
    geom_point(aes(color = inter_sig, size = logp)) +
    scale_size(range = c(0.05, 2.5), name = "-log10P about\nInteraction/Avoidance") +
    scale_fill_gradientn(colours = c("#404F8C","#7882B4","#FAFAFA","#A05050","#892A32"),
                         breaks = c(-1,-0.5,0,0.5,1), limit = c(-1,1), name="Coorelation of Cell\nPercentage Per ROIs") +
    scale_color_gradientn(colours = c("#404F8C","#7882B4","#939BC3","#AEB4D2","#FAFAFA","#C69696","#B37373","#A05050","#892A32"),
                          breaks = c(-1,-0.75,-0.5,-0.25,0,0.25,0.5,0.75,1), limit = c(-1,1),
                          name="Sig of Interaction/Avoidance\nBased on Permutation Test") +
    theme_classic() + ggtitle(i) +
    theme(axis.text.x = element_text(angle = 60, hjust = 1, size = 5), axis.text.y = element_text(size = 5),
          legend.key.height = unit(0.2, "cm"), legend.key.width = unit(0.2, "cm"), legend.text = element_text(size = 4),
          legend.title = element_text(size = 5), axis.title = element_text(size = 5),
          title = element_text(size = 5))

  ggsave(glue::glue("{res_dir}/fig4a_{i}_interaction_heatmap.pdf"), pl[[i]], height = 4, width = 5.2)
}

p1 <- pl[["MC-tumor-frontline"]] + theme(legend.position = "none")
p2 <- pl[["MC-stroma-macro"]] + theme(legend.position = "none")
p3 <- pl[["MC-others"]]

p <- p1 | p2 | p3 + plot_layout(guides = 'collect')
#ggsave(glue::glue("{res_dir}/fig4a_heatmap.pdf"), p, width = 12.5, height = 4)
p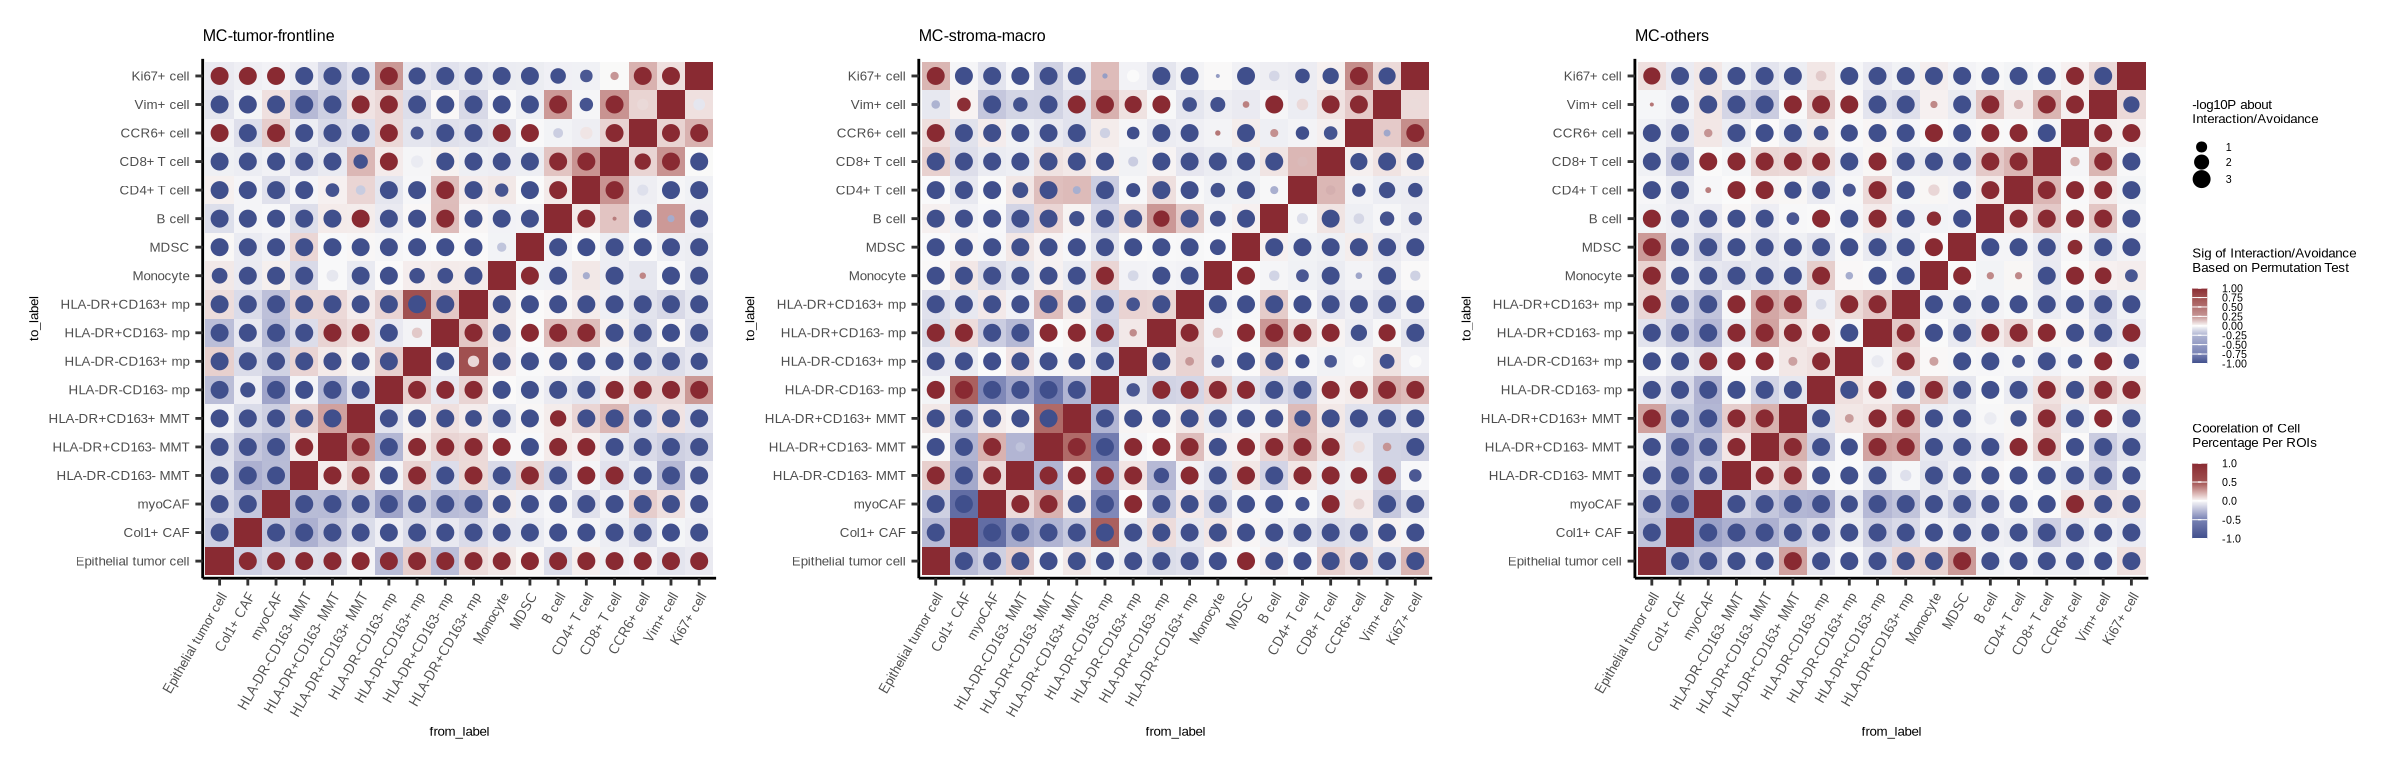
figure4b
#summary cell type prop
cell_type_meta3_total <- coldat %>% dplyr::filter(sample_id %in% sample_chemo_type_list$no_chemo_all) %>%
  group_by(sample_id, meta_merge) %>% summarise(nt = n()) %>% ungroup()

cell_type_meta3 <- coldat %>% dplyr::filter(sample_id %in% sample_chemo_type_list$no_chemo_all) %>%
  group_by(sample_id, cell_type_new, meta_merge) %>% summarise(nc = n()) %>% ungroup()

cell_type_meta3$cell_type_new <- factor(cell_type_meta3$cell_type_new)
cell_type_meta3 <- cell_type_meta3 %>%
  group_by(sample_id, meta_merge) %>%
  tidyr::complete(cell_type_new, fill = list(nc = 0)) %>% ungroup()
cell_type_meta3 <- left_join(cell_type_meta3_total, cell_type_meta3, by = c("sample_id", "meta_merge")) %>%
  dplyr::mutate(prop = nc/nt) %>% dplyr::select(-c(nt, nc)) %>% distinct()

#add os info
cell_type_meta3 <- left_join(cell_type_meta3, sinfo, by = "sample_id") %>%
  dplyr::select(sample_id, cell_type_new, meta_merge, prop, pfs_state, pfs_month, os_state, os_month)

cell_type_meta3_tb <- cell_type_meta3 %>% dplyr::filter(cell_type_new == "HLA-DR-CD163- mp") %>%
  dplyr::filter(meta_merge == "MC-tumor-frontline") %>%
  dplyr::mutate(group_mean = case_when(prop >= mean(prop) ~ "high", prop < mean(prop) ~ "low"))

cell_type_meta3_tb_os <- cell_type_meta3_tb %>% dplyr::select(sample_id, os_state, os_month, group_mean) %>% na.omit()

#mean group
psurvx <- ggsurvplot(surv_fit(Surv(os_month, os_state) ~ group_mean, data = cell_type_meta3_tb_os), palette = ggsci::pal_nejm("default")(2),
                     legend.labs = levels(droplevels(as.factor(unlist(cell_type_meta3_tb_os[, "group_mean"])))),
                     pval=T, risk.table = F, xlim = c(0,75))
ggsave(glue::glue("{res_dir}/fig4b_DNmac_Tumor_boundary_os_mean.pdf"),
       plot = psurvx$plot, width = 7, height = 7)
psurvx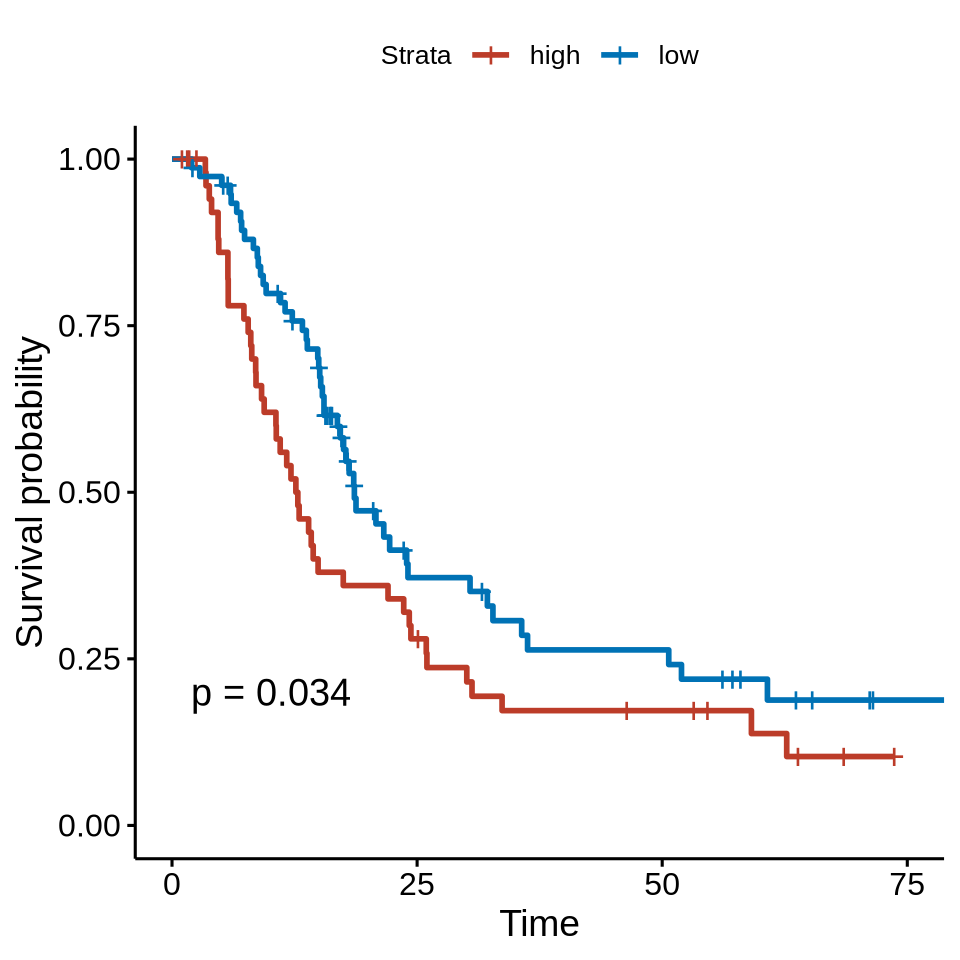
figure4c
my_comparisons <- list(c("MC-stroma-macro", "MC-tumor-frontline"), c("MC-stroma-macro", "MC-others"), c("MC-tumor-frontline", "MC-others"))

Macrophage_Dn_total <- coldat %>% dplyr::filter(cell_type_new == "HLA-DR-CD163- mp") %>%
  dplyr::filter(sample_id %in% sample_chemo_type_list$no_chemo_all) %>%
  group_by(sample_id, meta_merge) %>% summarise(nt = n()) %>% ungroup()

i = "PD_L1_pos_Macrophage"

Macrophage_Dn_pos <- coldat %>% dplyr::filter(cell_type_new == "HLA-DR-CD163- mp") %>%
  dplyr::filter(sample_id %in% sample_chemo_type_list$no_chemo_all) %>%
  dplyr::filter(cell_id %in% pos_cells10[[i]]) %>%
  group_by(sample_id, meta_merge) %>% summarise(np = n()) %>% ungroup()
Macrophage_Dn_pos <- left_join(Macrophage_Dn_total, Macrophage_Dn_pos, by = c("sample_id", "meta_merge")) %>%
  replace_na(list(np = 0)) %>% dplyr::mutate(prop = np/nt) %>%
  ungroup() %>% dplyr::select(-c(nt, np)) %>%
  dplyr::filter(meta_merge != "MC-tumor-core") %>%
  group_by(meta_merge) %>% dplyr::mutate(gn = n()) %>% ungroup

Macrophage_Dn_pos$meta_merge <- factor(Macrophage_Dn_pos$meta_merge, levels = c("MC-tumor-frontline", "MC-stroma-macro", "MC-others"))
yname <- str_replace_all(i, c("_pos_" = "+ ", "Macrophage" = "Mp", "_" = "-"))


p <- ggplot(Macrophage_Dn_pos, aes(x = meta_merge, y = prop, fill = meta_merge, color = meta_merge)) +
  introdataviz::geom_flat_violin(aes(color = meta_merge), position = position_nudge(x = .25), bounds = c(0, 0.5)) +
  geom_jitter(aes(color = meta_merge), width = 0.1, size = 0.25) +
  geom_boxplot(width = .1, position = position_nudge(x = .25), fill = "white", linewidth = 0.25, outlier.shape = NA) +
  scale_fill_manual(values = meta_merge_cols) +  scale_color_manual(values = meta_merge_cols) +
  scale_y_continuous(limits=c(0, 0.6), oob = scales::rescale_none) +
  stat_compare_means(aes(label = "p.signif"), hide.ns = F, tip.length = 0.02, bracket.size = 0.1,
                     comparisons = my_comparisons, method = "wilcox.test",
                     size = 2, label.y = c(0.51,0.52,0.53)) +
  directlabels::geom_dl(aes(label = gn),
                        method = list("last.points", cex = .5)) +
  ylab(glue::glue("Proportion of {yname}")) + theme_bmbdc() +
  theme(axis.title.y = element_text(size = 8),
    axis.text.y = element_text(size = 6),
    axis.title.x = element_blank(),
    axis.text.x = element_text(size = 8, angle = 20, hjust = 1),
    legend.position = "none")
ggsave(glue::glue("{res_dir}/fig4c_pdl1_mac_sample_meta3_compare.pdf"), p, width = 3, height = 3)
p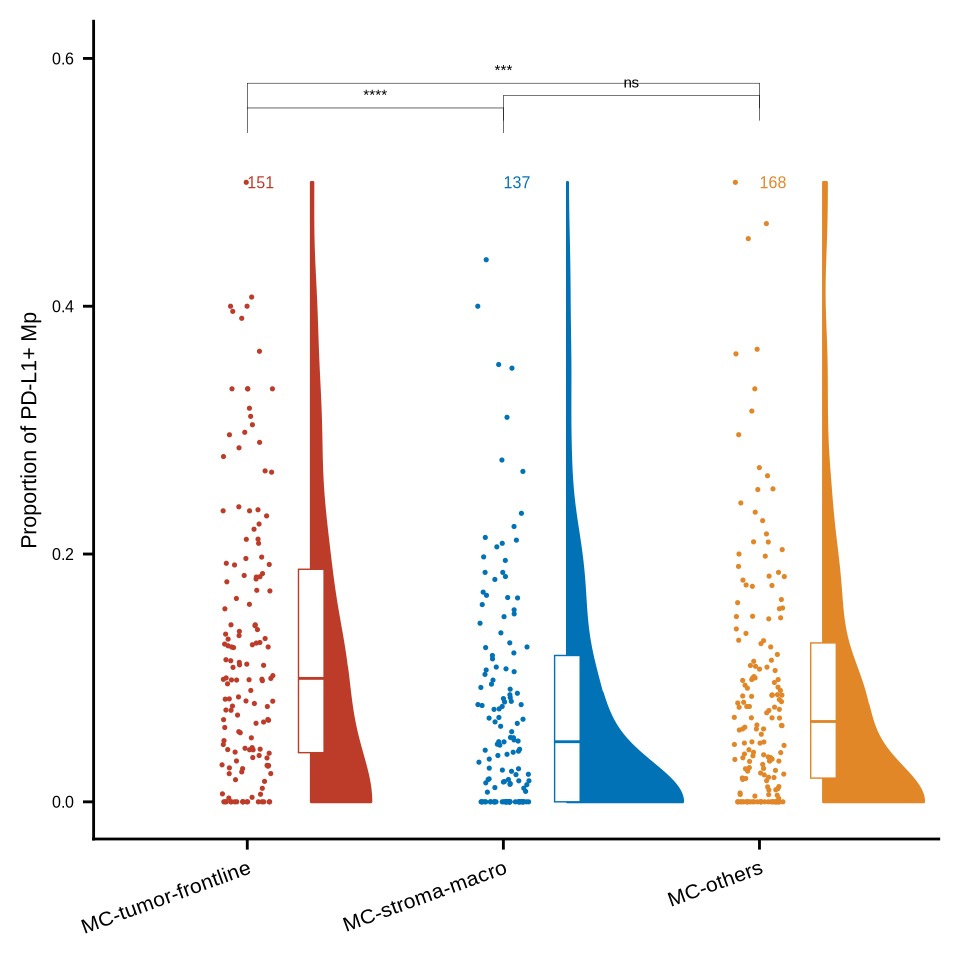
figure4d
my_comparisons <- list(c("MC-stroma-macro", "MC-tumor-frontline"), c("MC-stroma-macro", "MC-others"), c("MC-tumor-frontline", "MC-others"))

# CD8T to DN_Macrophage ----------------------------
df_closecell_distance_SM <- readr::read_rds(glue::glue("{dat_dir}/distance_rds/SM_list_closecell_dist_k1_CD8T_to_Macrophage_DN.rds")) %>%
  do.call("rbind", .) %>% as_tibble() %>% dplyr::mutate(meta_merge = "MC-stroma-macro")
df_closecell_distance_TB <- readr::read_rds(glue::glue("{dat_dir}/distance_rds/TB_list_closecell_dist_k1_CD8T_to_Macrophage_DN.rds")) %>%
  do.call("rbind", .) %>% as_tibble() %>% dplyr::mutate(meta_merge = "MC-tumor-frontline")
df_closecell_distance_others <- readr::read_rds(glue::glue("{dat_dir}/distance_rds/OthersnoBT_list_closecell_dist_k1_CD8T_to_Macrophage_DN.rds")) %>% do.call("rbind", .) %>% as_tibble() %>% dplyr::mutate(meta_merge = "MC-others")

df_closecell_distance <- rbind(df_closecell_distance_SM, df_closecell_distance_TB, df_closecell_distance_others) %>% as_tibble()
df_closecell_distance <- df_closecell_distance %>%
  left_join(coldat[, c("sample_id", "cell_id", "meta_merge")] %>%
              dplyr::rename(from_cell = cell_id), by = c("from_cell", "meta_merge")) %>%
  dplyr::filter(sample_id %in% sample_chemo_type_list$no_chemo_all) %>%
  dplyr::filter(meta_merge != "MC-tumor-core")

df_closecell_distance$meta_merge <- factor(df_closecell_distance$meta_merge, levels = c("MC-tumor-frontline", "MC-stroma-macro", "MC-others") %>% rev())

p <- ggdensity(df_closecell_distance, x = "distance",
               add = "mean",
               color = "meta_merge",
               palette = meta_merge_cols) +
  scale_x_continuous(limits=c(0,200), oob = scales::rescale_none) +
  theme(axis.title.y = element_blank(),
        axis.text.y = element_text(size = 6),
        axis.title.x = element_text(size = 6),
        axis.text.x = element_text(size = 6),
        legend.position = "none")
ggsave(glue::glue("{res_dir}/fig4d_CD8T_to_Macrophage_Dn_minDis_meta3_compare_density.pdf"), p, width = 3, height = 3)
p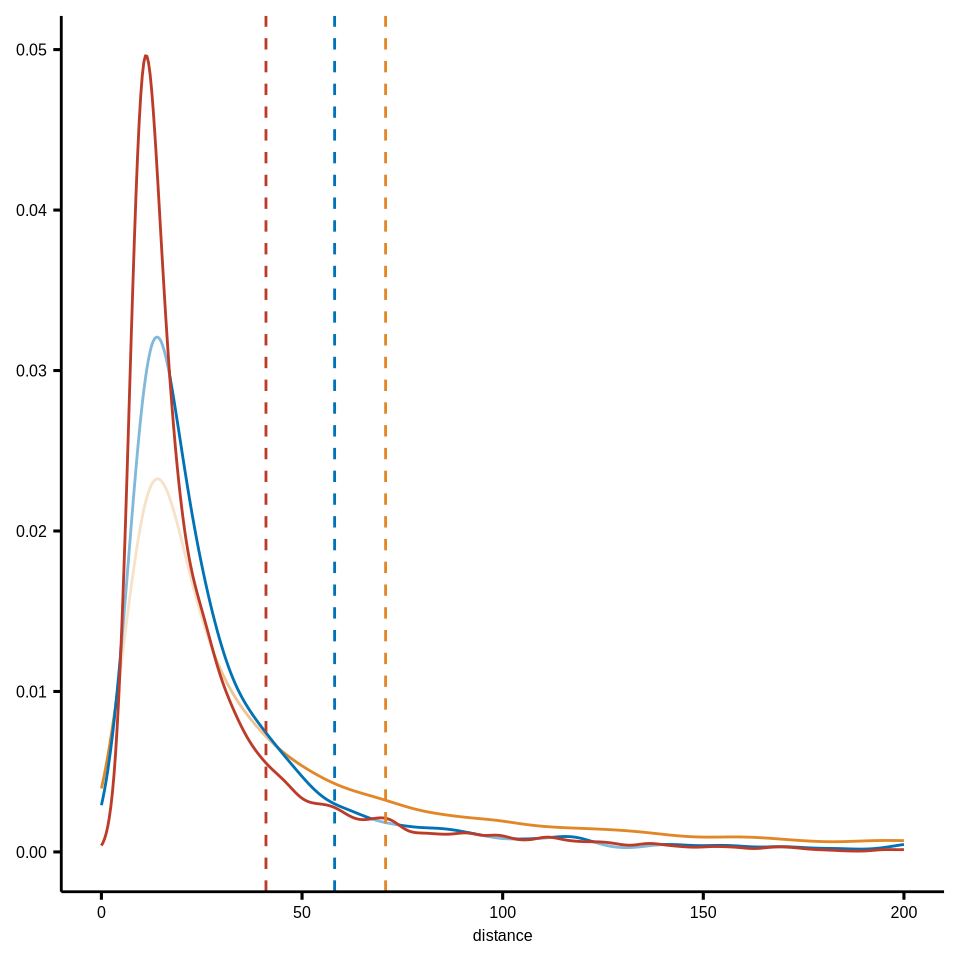
figure4f
coldat <- coldat %>%
  dplyr::mutate(cell_type11 = case_when(cell_type_new %in%
                                          c("HLA-DR+CD163- mp", "HLA-DR+CD163+ mp", "HLA-DR-CD163+ mp") ~ "Other-mp",
                                        cell_type_new %in% c("HLA-DR-CD163- mp") ~ "DN-mp",
                                        TRUE ~ cell_type_new))

mac_colors <- c("DN-mp" = "#BC3C29FF", "Other-mp" = "#0072B5FF")

df_dnmac <- readr::read_rds(glue::glue("{dat_dir}/distance_rds/TB_list_closecell_dist_k1_CD8T_to_Macrophage_DN.rds")) %>%
  do.call("rbind", .) %>% as_tibble()
df_othmac <- readr::read_rds(glue::glue("{dat_dir}/distance_rds/TB_list_closecell_dist_k1_CD8T_to_Macrophage_oth.rds")) %>%
  do.call("rbind", .) %>% as_tibble()

df_mac <- rbind(df_dnmac, df_othmac) %>% as_tibble()
df_mac <- df_mac %>%
  inner_join(coldat, by = c("to_cell" = "cell_id")) %>%
  dplyr::filter(sample_id %in% c(sample_chemo_type_list[["chemo"]],
                                 sample_chemo_type_list[["no_chemo_no_punc"]])) %>%
  dplyr::mutate(chemo = case_when(sample_id %in% sample_chemo_type_list[["chemo"]] ~ "Surgery after chemo",
                                  TRUE ~ "Upfront surgery"))
#sample
df_mac_mean <- df_mac %>% group_by(sample_id, cell_type11, chemo) %>%
  dplyr::summarise(mean_dis = mean(distance)) %>%
  group_by(sample_id, chemo) %>% dplyr::mutate(nc = n()) %>%
  ungroup() %>% dplyr::filter(nc > 1)

df_mac_mean$cell_type11 <- factor(df_mac_mean$cell_type11, levels = c("DN-mp", "Other-mp"))
df_mac_mean$chemo <- factor(df_mac_mean$chemo, levels = c("Upfront surgery", "Surgery after chemo"))


stat_test <- df_mac_mean %>%
  group_by(chemo) %>% rstatix::wilcox_test(mean_dis ~ cell_type11, paired = T)
stat_test <- stat_test %>% mutate(p.adj.signif = case_when(p >= 0.05 ~ "ns",
                                                           p >= 0.01 & p < 0.05 ~ "*",
                                                           p >= 0.001 & p < 0.01 ~ "**",
                                                           p >= 0.0001 & p < 0.001 ~ "***",
                                                           p < 0.0001 ~ "****",
                                                           TRUE ~ "ns"))
stat_test <- stat_test %>%
  rstatix::add_xy_position(x = "chemo", dodge = 0.9, fun = "median_iqr")
stat_test$y.position <- 12

df_mac_mean <- df_mac_mean %>% group_by(cell_type11, chemo) %>% dplyr::mutate(nc = n())

p1 <- ggplot(df_mac_mean,
             aes(x = chemo, y = log2(mean_dis))) +
  introdataviz::geom_split_violin(aes(x = chemo, y = log2(mean_dis), color = cell_type11),
                                  trim = FALSE, linewidth = .3) +
  geom_boxplot(aes(fill = cell_type11), width = .1, show.legend = FALSE,
               outlier.size = .2, linewidth = .2, color = "black") +
  scale_fill_manual(values = mac_colors, name = "MC-tumor-frontline") +
  scale_colour_manual(values = mac_colors, name = "MC-tumor-frontline") +
  labs(y = "Log2(Mean distance) of CD8T to Mp") +
  directlabels::geom_dl(aes(label = nc),
                        method = list("top.points", cex = .4)) +
  theme_bmbdc() +
  theme(title = element_text(size = 6),
        axis.ticks = element_line(colour = "black"),
        axis.title.y = element_text(size = 6),
        axis.text.y = element_text(size = 6, colour = "black"),
        axis.title.x = element_blank(),
        axis.text.x = element_text(size = 6, colour = "black"),
        axis.line.x = element_line(linewidth = 0.4),
        axis.line.y = element_line(linewidth = 0.4),
        legend.position="top",
        legend.text = element_text(size = 4),
        legend.title = element_text(size = 4),
        legend.key.size = unit(0.1, 'cm')) +
  stat_pvalue_manual(stat_test, x = "chemo", tip.length = 0.01, hide.ns = F, label = "p.adj.signif", size = 1.5)
ggsave(glue::glue("{res_dir}/fig4f_CD8T_to_mac_dis_3metas_cacb_persam_paired.pdf"), p1, width = 3, height = 3)
p1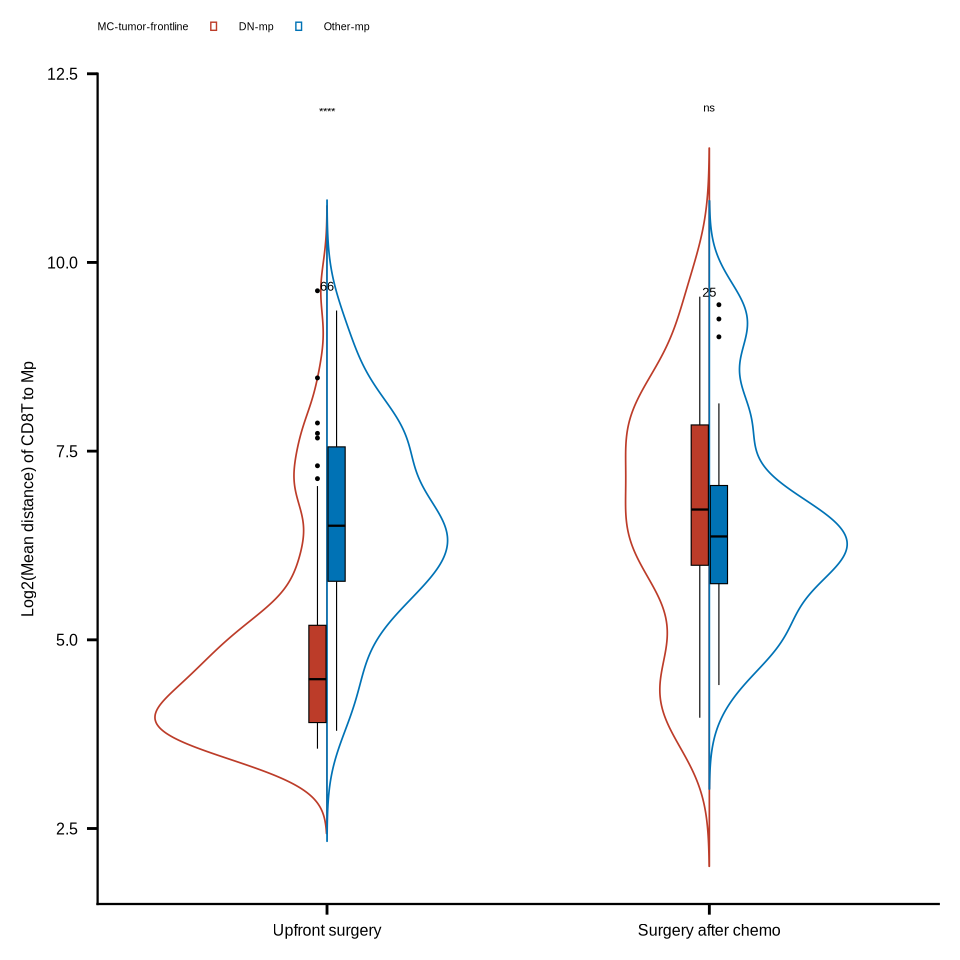
figure4g
#distance plot function
dist_to_DNmac_compare_meta3_func <- function(datadir, k, query_cell, target_cell, my_comparisons, cld, colors){
TB_dist <- read_rds(glue::glue("{datadir}/distance_rds/TB_list_closecell_dist_k{k}_{query_cell}_to_{target_cell}.rds")) %>%
do.call("rbind", .) %>% as_tibble() %>% dplyr::mutate(group = "MC-tumor-frontline")
SM_dist <- read_rds(glue::glue("{datadir}/distance_rds/SM_list_closecell_dist_k{k}_{query_cell}_to_{target_cell}.rds")) %>%
do.call("rbind", .) %>% as_tibble() %>% dplyr::mutate(group = "MC-stroma-macro")
Other_dist <- read_rds(glue::glue("{datadir}/distance_rds/OthersnoBT_list_closecell_dist_k{k}_{query_cell}_to_{target_cell}.rds")) %>%
do.call("rbind", .) %>% as_tibble() %>% dplyr::mutate(group = "MC-others")
df_dist <- rbind(TB_dist, SM_dist, Other_dist) %>%
dplyr::filter(to_cell %in% (cld %>% dplyr::filter(cell_type_new == "HLA-DR-CD163- mp") %>% .$cell_id)) %>%
dplyr::select(from_cell, distance, group) %>%
dplyr::filter(from_cell %in% (cld %>% dplyr::filter(sample_id %in% sample_chemo_type_list$no_chemo_all) %>% .$cell_id))
plist <- list()
#density
plist[[1]] <- ggdensity(df_dist, x = "distance",
add = "mean",
color = "group",
palette = colors) +
scale_x_continuous(limits=c(0,200), oob = scales::rescale_none) +
theme(axis.title.y = element_blank(),
axis.text.y = element_text(size = 6),
axis.title.x = element_text(size = 6),
axis.text.x = element_text(size = 6),
legend.position = "none")
#boxplot
df_dist[["group"]] <- factor(df_dist[["group"]], levels = c("MC-tumor-frontline", "MC-stroma-macro", "MC-others"))
stat_test <- df_dist %>% rstatix::wilcox_test(distance ~ group, comparisons = my_comparisons)
stat_test$y.position <- c(8.8,9.3,9.8)
plist[[2]] <- ggplot(df_dist,
aes(x = group, y = log2(distance))) +
geom_boxplot(aes(fill = group), width = .2, show.legend = FALSE,
outlier.shape = NA, linewidth = .2, color = "black") +
scale_y_continuous(limits=c(2,10), oob = scales::rescale_none) +
labs(y = glue::glue("Log2(Distance) of {query_cell} to DN-mp")) +
scale_fill_manual(values = colors) +
stat_pvalue_manual(stat_test, tip.length = .03, bracket.size = 0.2, label = "p.adj.signif", size = 2) +
#directlabels::geom_dl(aes(label = ng), method = list("top.points", cex = .4)) +
theme_bmbdc() +
theme(title = element_text(size = 6),
axis.ticks = element_line(colour = "black"),
axis.title.y = element_text(size = 6),
axis.text.y = element_text(size = 6, colour = "black"),
axis.title.x = element_blank(),
axis.text.x = element_text(size = 6, colour = "black", angle = 10),
axis.line.x = element_line(linewidth = 0.4),
axis.line.y = element_line(linewidth = 0.4),
legend.position="none")
# stat_test <- df_dist %>%
# rstatix::wilcox_test(distance ~ group, p.adjust.method = "BH")
# mean_distance <- df_dist %>% group_by(group) %>%
# dplyr::summarise(mean_dis = mean(distance), median_dis = median(distance))
# list("mean_distance" = mean_distance, "stat_test" = stat_test) %>% list2excel(glue::glue("{query_cell}_DNmac_distance_summary.xlsx"))
return(plist)
}
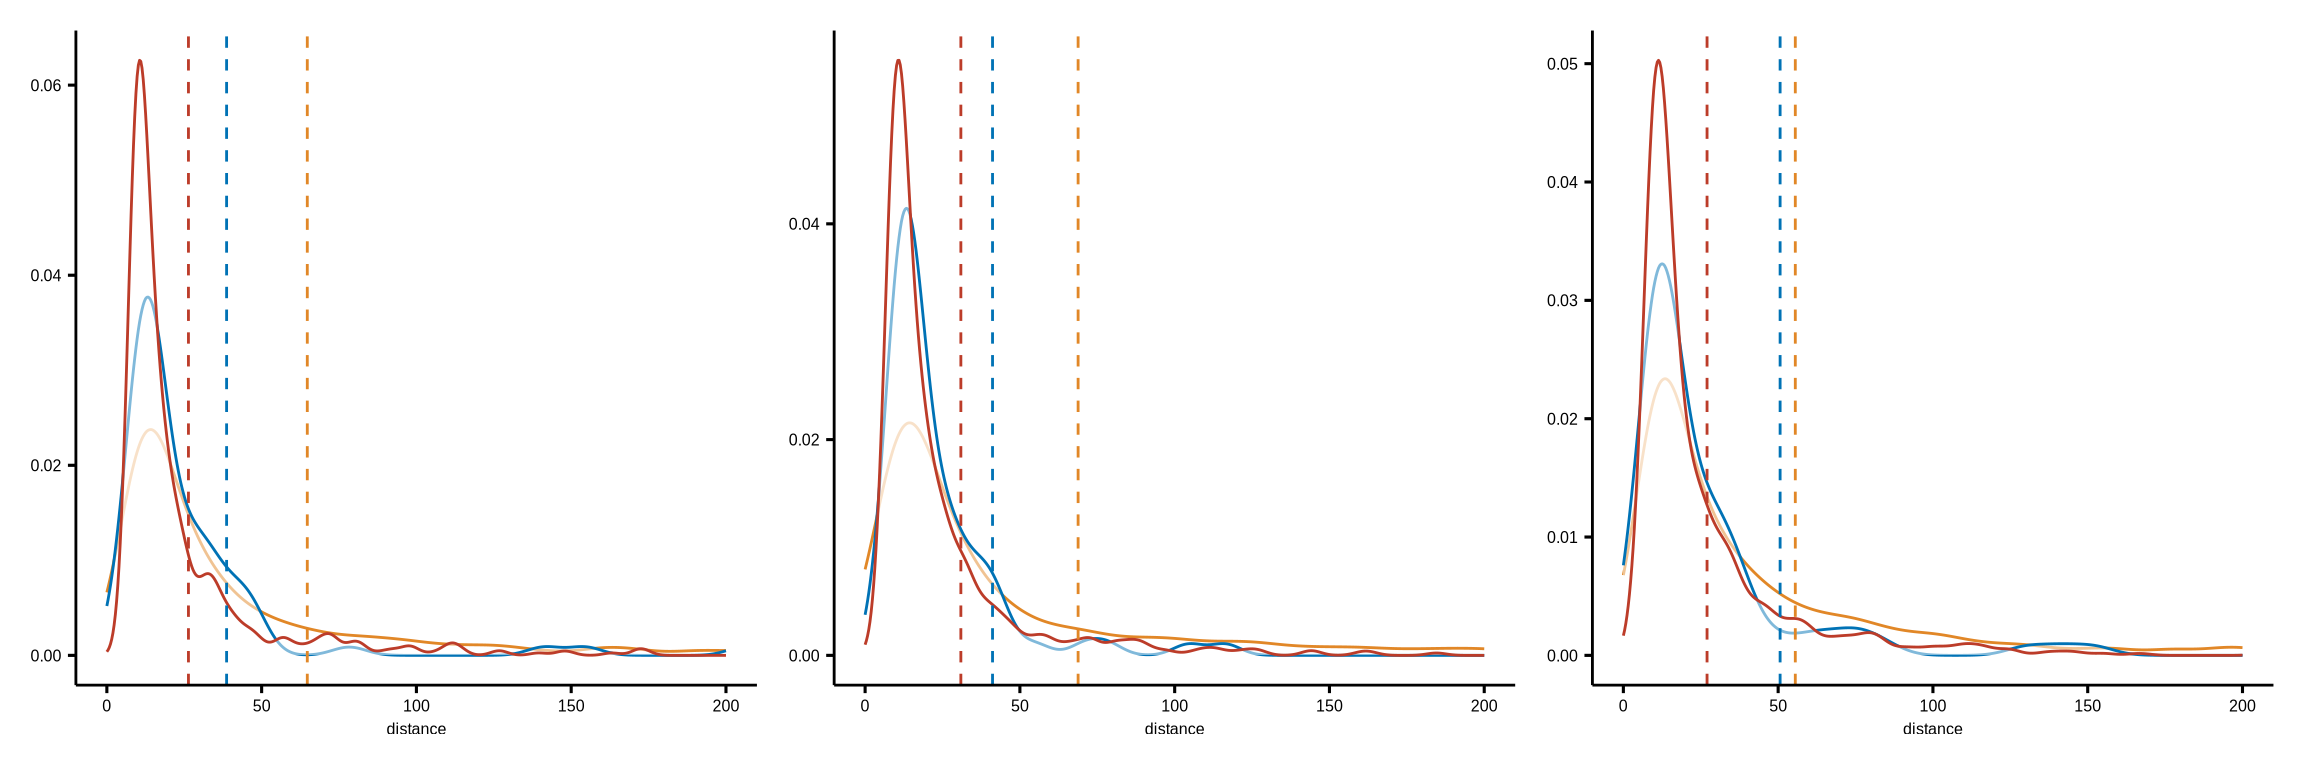
my_comparisons <- list(c("MC-tumor-frontline", "MC-stroma-macro"), c("MC-stroma-macro", "MC-others"), c("MC-tumor-frontline", "MC-others"))
#a
query_cell <- "LAG_3_pos_CD8T"
target_cell <- "Macrophage_HLADRn_CD163n"
p1 <- dist_to_DNmac_compare_meta3_func(datadir = dat_dir, k = 1, query_cell = query_cell,
target_cell = target_cell, my_comparisons = my_comparisons,
cld = coldat, colors = meta_merge_cols)
ggsave(glue::glue("{res_dir}/fig4g_LAG3CD8T_to_DN_mac_dist_density.pdf"), p1[[1]], width = 4, height = 4)
#b
query_cell <- "PD1_pos_CD8T"
target_cell <- "Macrophage_HLADRn_CD163n"
p2 <- dist_to_DNmac_compare_meta3_func(datadir = dat_dir, k = 1, query_cell = query_cell,
target_cell = target_cell, my_comparisons = my_comparisons,
cld = coldat, colors = meta_merge_cols)
ggsave(glue::glue("{res_dir}/fig4g_PD1CD8T_to_DN_mac_dist_density.pdf"), p2[[1]], width = 4, height = 4)
#c
query_cell <- "Vista_pos_CD8T"
target_cell <- "Macrophage_HLADRn_CD163n"
p3 <- dist_to_DNmac_compare_meta3_func(datadir = dat_dir, k = 1, query_cell = query_cell,
target_cell = target_cell, my_comparisons = my_comparisons,
cld = coldat, colors = meta_merge_cols)
ggsave(glue::glue("{res_dir}/fig4g_VISTACD8T_to_DN_mac_dist_density.pdf"), p3[[1]], width = 4, height = 4)
p <- p1[[1]] | p2[[1]] | p3[[1]]
ggsave(glue::glue("{res_dir}/fig4g_posCD8T_to_DN_mac_dist_density.pdf"), p, width = 12, height = 4)
p