pkgs <- c("fs", "futile.logger", "configr", "stringr", "ggpubr", "ggthemes",
          "vroom", "jhtools", "glue", "openxlsx", "ggsci", "patchwork", "cowplot",
          "tidyverse", "dplyr", "Seurat", "harmony", "ggpubr", "GSVA", "EnhancedVolcano",
          "monocle")
suppressMessages(conflicted::conflict_scout())
for (pkg in pkgs){
  suppressPackageStartupMessages(library(pkg, character.only = T))
}
res_dir <- "./results/sup_figure13" %>% checkdir
dat_dir <- "./data" %>% checkdir
config_dir <- "./config" %>% checkdir

#colors config
config_fn <- glue::glue("{config_dir}/configs.yaml")
scrna_cols <- jhtools::show_me_the_colors(config_fn, "scrna_cells")
scmac_type <- jhtools::show_me_the_colors(config_fn, "scmac_type")

#read in coldata
sce_mac <- read_rds(glue::glue("{dat_dir}/sce_mac_DNp50_retsne.rds"))
sce_all <- read_rds(glue::glue("{dat_dir}/sce_all_merge.rds"))
monocle2_obj <- read_rds(glue::glue("{dat_dir}/sc_mac_monocle2.rds"))sup_figure13
sup_figure13a
set.seed(2024)
ids <- sample(1:dim(sce_all)[2], 10000)
sesub <- sce_all[,ids]

p <- DimPlot(sesub, reduction = "tsne", group.by = "cell_types2",
             label = F, cols = scrna_cols, combine = F, pt.size = .001)
p <- p[[1]] +
  guides(color = guide_legend(keywidth = unit(0, "cm"),
                             keyheight = unit(0, "cm"),
         nrow = 3, byrow = T)) +
  theme(plot.title = element_blank(),
        axis.text = element_blank(),
        axis.title = element_text(size = 8),
        axis.line = element_blank(),
        axis.ticks = element_blank(),
        panel.background = element_blank(),
        panel.border = element_blank(),
        panel.spacing = unit(0, "mm"),
        plot.margin = margin(0,0,0,0),
        plot.background = element_blank(),
        legend.margin = margin(0,0,0,0),
        legend.box.margin = margin(0,0,0,0),
        legend.spacing.y = unit(0, "mm"),
        legend.spacing.x = unit(0, "mm"),
        legend.position = "top",
        legend.text = element_text(size = 6, margin = margin(-.5,-5,0,1)))
print(p)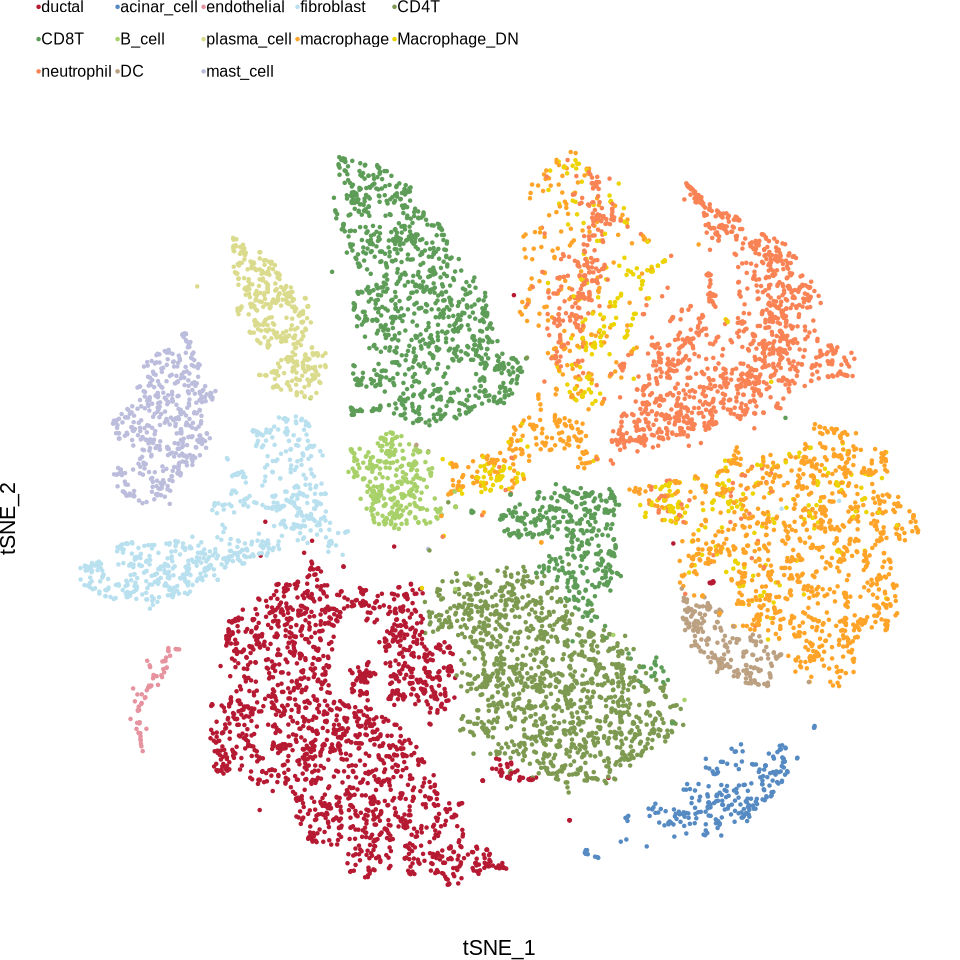
sup_figure13b
Idents(sce_all) <- "cell_types2"

p <- DotPlot(sce_all, features = c('EPCAM', 'KRT19', 'CPA1', 'VWF', 'ACTA2','PTPRC',
                                             'CD3D', 'CD4', 'CD8A', 'CD79A', 'MS4A1','XBP1',
                                             'CD68', 'HLA-DRA', 'HLA-DRB5', 'CD163', 'CD14',
                                             'FCGR3A', 'FCGR3B', 'CEACAM3', 'CD1C',
                                             'BATF3', 'TPSAB1','KIT'), #scale = F,
             dot.scale = 3) + RotatedAxis() + theme_bmbdc() +
  scale_colour_gradientn(colours = c("grey", "#ffe5e5", "#ff7f7f", "#ff6666", "#ff0000"),
                         values = scales::rescale(x = c(0, 1, 2, 3, 3.5), from = c(0, 3.5))) +
  guides(size = guide_legend(title = "Percent Expressed", keywidth = unit(1, "cm"),
                             keyheight = unit(.2, "cm"), nrow = 2, byrow = T)) +
  guides(color = guide_colorbar(title = "Expression", barwidth = unit(1, "cm"), barheight = unit(.2, "cm"))) +
  theme(axis.text = element_text(size = 6),
        axis.title.x = element_blank(),
        axis.title.y = element_blank(),
        panel.background = element_blank(),
        panel.border = element_blank(),
        panel.spacing = unit(0, "mm"),
        plot.margin = margin(0,0,0,0),
        plot.background = element_blank(),
        legend.box.margin = margin(0,0,0,0),
        legend.spacing.y = unit(0, "mm"),
        legend.spacing.x = unit(0, "mm"),
        legend.key.size = unit(.2, 'cm'),
        axis.text.x = element_text(angle = 25, vjust = 1, hjust = 1),
        #axis.text.y = element_text(angle = 10),
        axis.line.x = element_line(linewidth = 0.4),
        axis.line.y = element_line(linewidth = 0.4),
        legend.margin = margin(0,0,0,0),
        legend.title = element_text(size=6, margin = margin(-.5,-5,0,1)),
        legend.text = element_text(size=6, margin = margin(-.5,-5,0,1)),
        legend.position = "top")

print(p)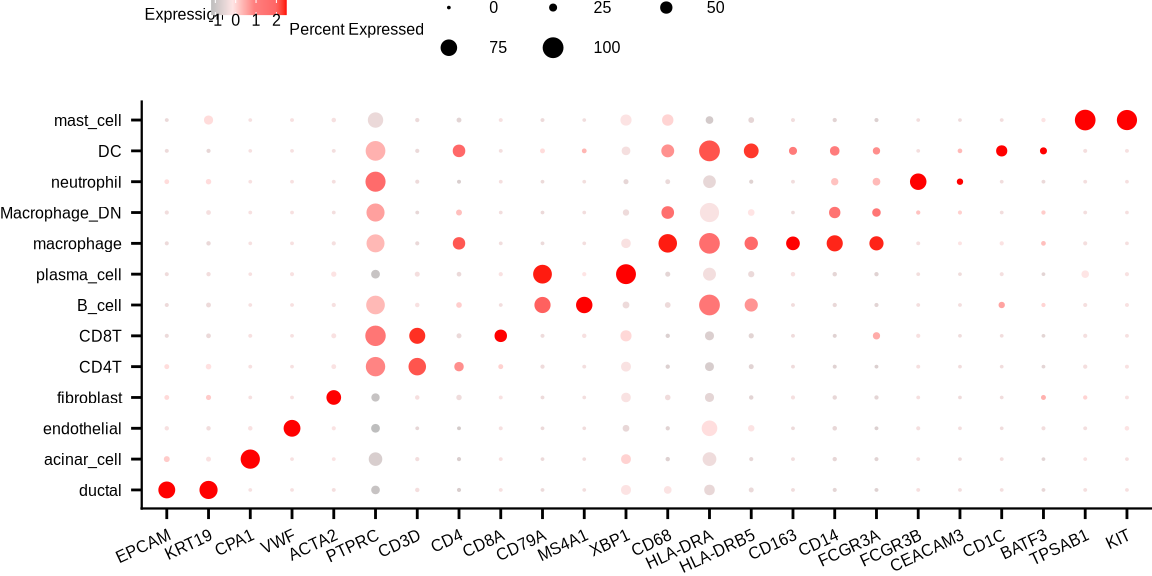
sup_figure13c
smplec_col <- c("#5D9D58", "#7E9A51", "#a9d169", "#BBA082",
                         "#BEA278", "#FFA428", "#F4C321", "#db9721",
                         "#ecd400", "#A56F95", "#BAA4CB", "#BCBDDC",
                         "#DDBE91", "#404BA5", "#568AC2", "#86BBDA",
                         "#B9E0EE", "#E6939F", "#B61932", "#F98354",
                         "#dbdb8d", "#74DA00", "#49BADB", "#d9d9d9")

Idents(sce_mac) <- "cell_types3"
sce_mac$orig.ident <- str_replace_all(sce_mac$orig.ident, "DAC_TISSUE_", "")

p1 <- DimPlot(sce_mac, reduction = "tsne", group.by = "orig.ident", pt.size = .001,
             label = F, cols = smplec_col, combine = F)
p1 <- p1[[1]] +
  guides(color = guide_legend(keywidth = unit(0, "cm"),
                              keyheight = unit(0, "cm"),
                              nrow = 2, byrow = T)) +
  theme(plot.title = element_blank(),
        axis.text = element_blank(),
        axis.title = element_text(size = 8),
        axis.line = element_blank(),
        axis.ticks = element_blank(),
        panel.background = element_blank(),
        panel.border = element_blank(),
        panel.spacing = unit(0, "mm"),
        plot.background = element_blank(),
        plot.margin = margin(1,1,1,1),
        legend.margin = margin(0,0,0,0),
        legend.box.margin = margin(0,0,0,0),
        legend.spacing.y = unit(0, "mm"),
        legend.spacing.x = unit(0, "mm"),
        legend.position = "top",
        legend.text = element_text(size = 6, margin = margin(-2,-5,0,1)))


p2 <- DimPlot(sce_mac, reduction = "tsne", group.by = "cell_types3", pt.size = .001,
             label = F, cols = scmac_type, combine = F)
p2 <- p2[[1]] +
  guides(color = guide_legend(keywidth = unit(0, "cm"),
                              keyheight = unit(0, "cm"),
         nrow = 2, byrow = T)) +
  theme(plot.title = element_blank(),
        axis.text = element_blank(),
        axis.title = element_text(size = 8),
        axis.line = element_blank(),
        axis.ticks = element_blank(),
        panel.background = element_blank(),
        panel.border = element_blank(),
        panel.spacing = unit(0, "mm"),
        plot.background = element_blank(),
        plot.margin = margin(1,1,1,1),
        legend.margin = margin(0,0,0,0),
        legend.box.margin = margin(0,0,0,0),
        legend.spacing.y = unit(0, "mm"),
        legend.spacing.x = unit(0, "mm"),
        legend.position = "top",
        legend.text = element_text(size = 6, margin = margin(-4,-5,0,1)))
p1 | p2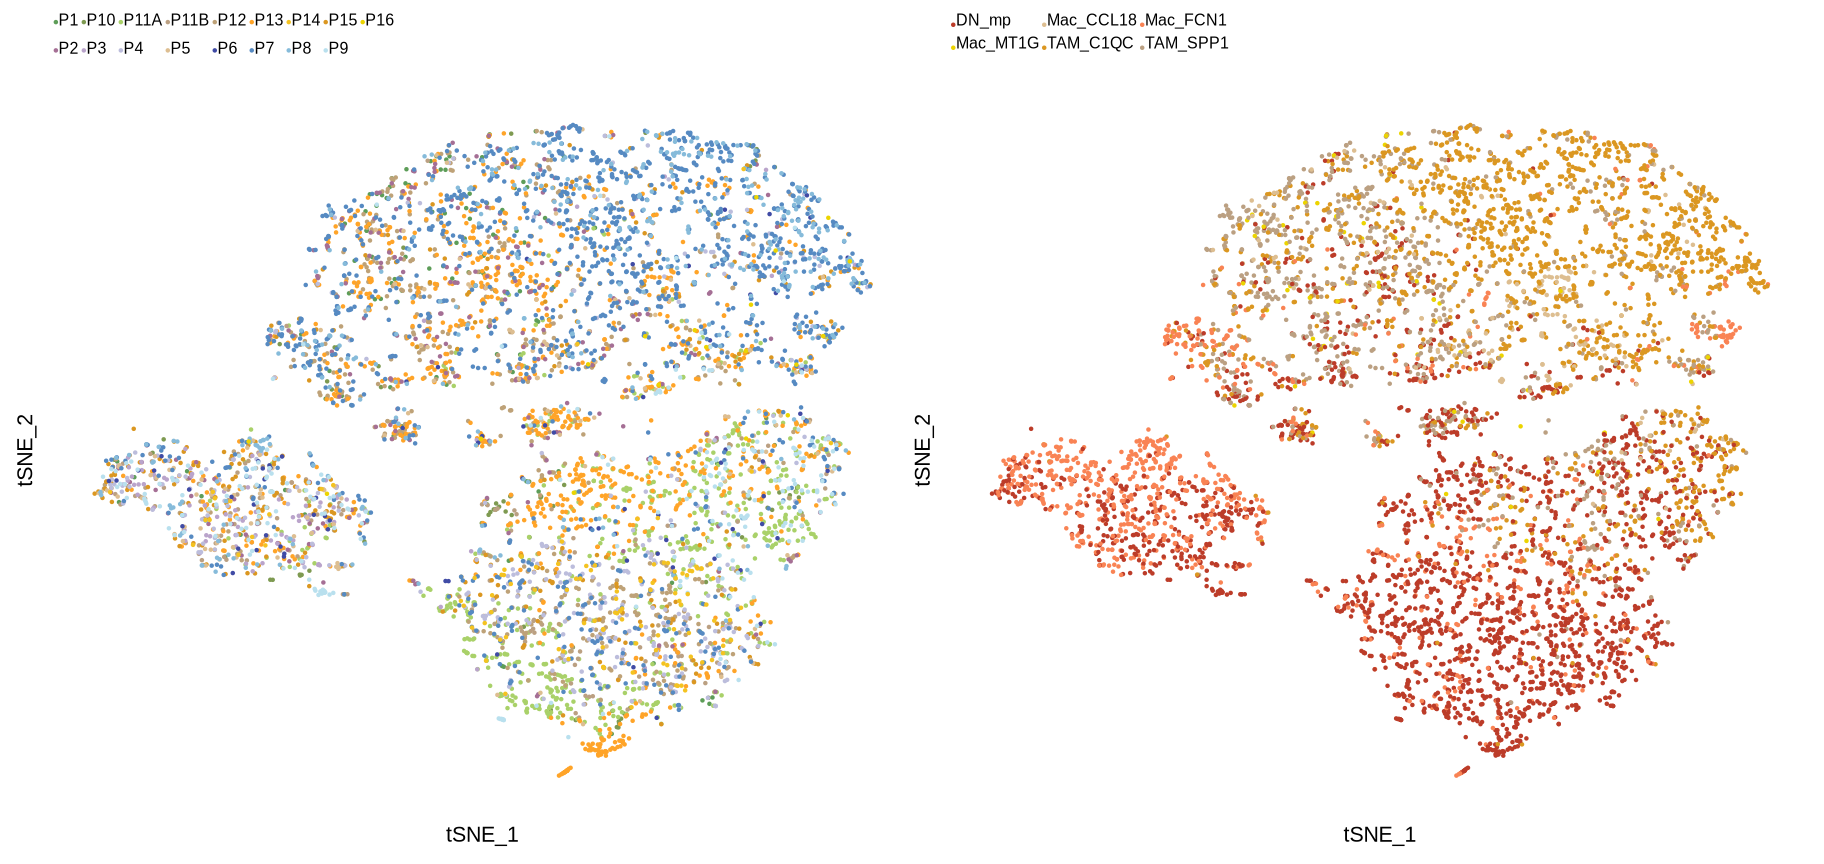
sup_figure13d
pl <- list()
for (i in c("CD68", "SPP1", "C1QC", "FCN1", "CCL18", "MT1G")) {
  #pdf(glue::glue("{res_dir}/sfig13d_sce_mac_{i}_exp_featureplot.pdf"), width = 2.5, height = 2)
  pl[[i]] <- FeaturePlot(sce_mac, reduction = "tsne", features = i,
                   order = T, pt.size = .001, combine = F)
  pl[[i]] <- pl[[i]][[1]] +
    guides(color = guide_colourbar(barwidth = unit(.1, "cm"),
                                   barheight = unit(.6, "cm"),
                                   title = i,
                                   title.position = "top")) +
    theme(plot.title = element_blank(),
          axis.text = element_blank(),
          axis.title = element_text(size = 8),
          axis.line = element_blank(),
          axis.ticks = element_blank(),
          panel.spacing = unit(0, "mm"),
          panel.border = element_rect(fill = NA, colour = NA),
          plot.background = element_rect(fill = NA, colour = NA),
          plot.margin = margin(0,0,0,0),
          legend.position = c(0,.8),
          legend.margin = margin(0,0,0,0),
          legend.title = element_text(size = 6),
          legend.text = element_text(size = 6))
  #print(pl[[i]])
  #dev.off()
}
(pl[[1]] | pl[[2]])/(pl[[3]] | pl[[4]])/(pl[[5]] | pl[[6]])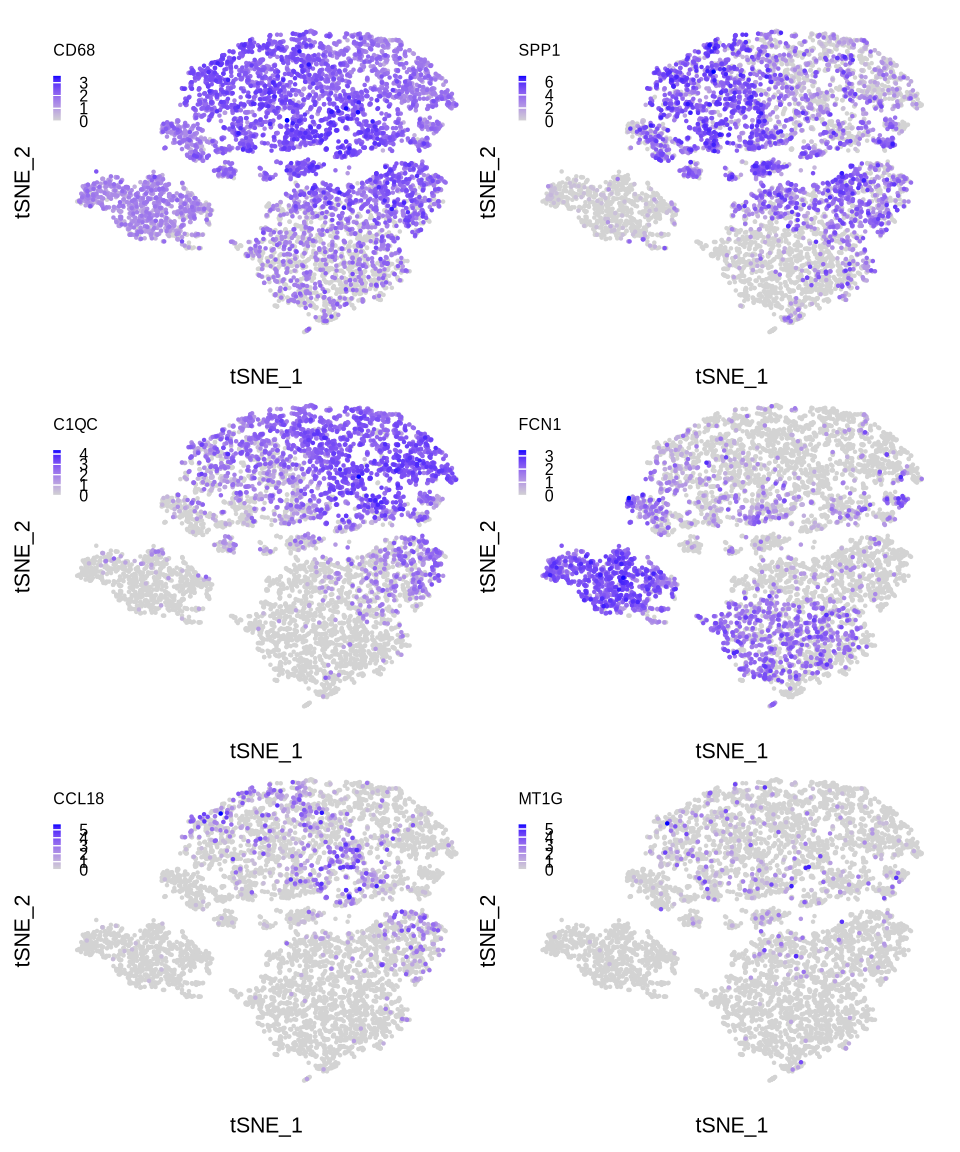
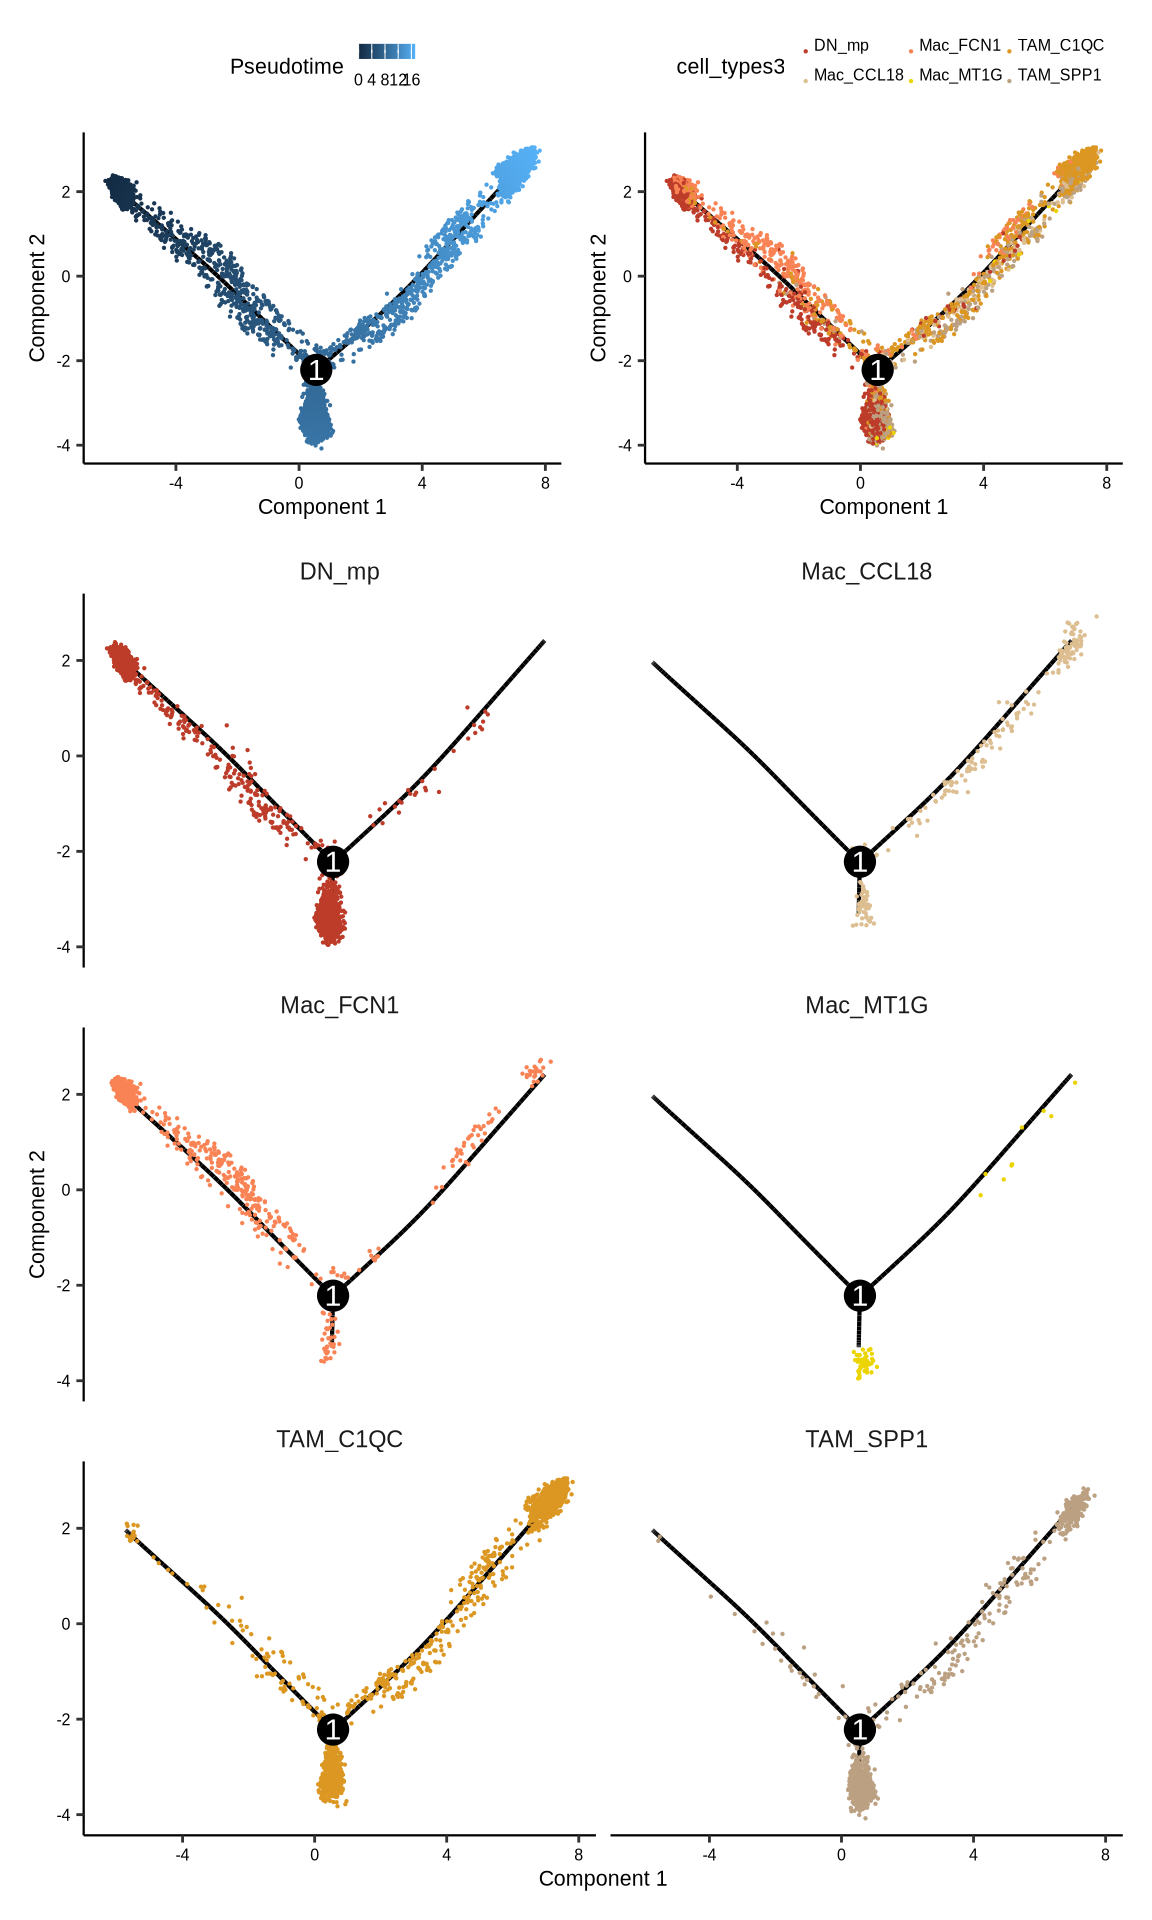
sup_figure13e
#monocle2
#pdf(glue::glue("{res_dir}/sfig13e1_monocle2.pdf"),width = 3,height = 3)
p1 <- plot_cell_trajectory(monocle2_obj, color_by="Pseudotime", cell_size=.1,
                          show_backbone=TRUE, cell_name_size = .5, state_number_size = 1) +
  theme(axis.text = element_text(size = 6, colour = "black"),
        axis.title = element_text(size = 8, colour = "black"),
        axis.line.x = element_line(linewidth = 0.4, colour = "black"),
        axis.line.y = element_line(linewidth = 0.4, colour = "black"),
        legend.key.height = unit(.2, "cm"),
        legend.key.width = unit(.15, "cm"),
        legend.title = element_text(size = 8),
        legend.text = element_text(size = 6))

#pdf(glue::glue("{res_dir}/sfig13e2_monocle2.pdf"),width = 3, height = 3)
p2 <- plot_cell_trajectory(monocle2_obj, color_by="cell_types3", cell_size=.1,
                          show_backbone=TRUE) +
  scale_color_manual(values = scmac_type) + theme(legend.position = "right") +
  theme(axis.text = element_text(size = 6, colour = "black"),
        axis.title = element_text(size = 8, colour = "black"),
        axis.line.x = element_line(linewidth = 0.4, colour = "black"),
        axis.line.y = element_line(linewidth = 0.4, colour = "black"),
        legend.key.height = unit(.2, "cm"),
        legend.key.width = unit(.15, "cm"),
        legend.position = "top",
        legend.margin = margin(0,0,0,0),
        legend.box.margin = margin(0,0,0,0),
        legend.spacing.y = unit(0, "mm"),
        legend.spacing.x = unit(0, "mm"),
        legend.title = element_text(size = 8),
        legend.text = element_text(size = 6, margin = margin(-5,-5,0,1)))

#pdf(glue::glue("{res_dir}/sfig13e3_monocle2.pdf"),width = 8, height = 8)
p3 <- plot_cell_trajectory(monocle2_obj, cell_size=.1, color_by = "cell_types3") +
  facet_wrap("~cell_types3", nrow = 3) +
  scale_color_manual(values = scmac_type) +
  theme(axis.text = element_text(size = 6, colour = "black"),
        axis.title = element_text(size = 8, colour = "black"),
        axis.line.x = element_line(linewidth = 0.4, colour = "black"),
        axis.line.y = element_line(linewidth = 0.4, colour = "black"),
        legend.position = "none")

p <- (p1|p2)/(p3) + plot_layout(heights = c(0.8, 3))
print(p)